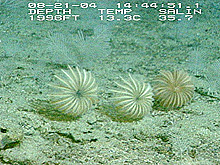
Sea lilies were scattered along the bottom at our dive site. These filter-feeding invertebrates are in the class Crinoidea (phylum Echinodermata). They catch particles from the water with tube feet, located on arms that branch outward from the center stalk. From the submersible window, these creatures look like flowers blowing in the breeze. Click image for larger view.
My First Submersible Dive: There's Beauty Behind the Blackness
August 22, 2004
Christina Ralph
Graduate Student
College of Charleston
![]() An
example of vertical topography at Sponge Cliff. (mp4, 3.5 MB)
An
example of vertical topography at Sponge Cliff. (mp4, 3.5 MB)
![]() A
hard layer of manganese phosphorite pavement. We see this type of sea floor often during the Estuary to the Abyss cruise . (mp4, 2.7 MB)
A
hard layer of manganese phosphorite pavement. We see this type of sea floor often during the Estuary to the Abyss cruise . (mp4, 2.7 MB)
![]() Collecting
a sponge community with the "Chimneymaster." (mp4, 4.8 MB)
Collecting
a sponge community with the "Chimneymaster." (mp4, 4.8 MB)
I am still in shock after yesterday’s experience. I cannot believe that I have descended hundreds of meters to the bottom of the ocean in a submersible and have seen the critters that inhabit this amazing environment. I am grateful to be a part of this research cruise, not only because it is a wonderful opportunity, but also because I’m learning more about the field component of my thesis project and how data is collected using a research submersible, such as the Johnson-Sea-Link II.
In my project, I am describing fish assemblages that live on deep reefs off the Southeast coast of the U.S. I am trying to determine how these assemblages have changed over time, and whether there is any relationship between fish assemblages and habitat type. In order to study these fish, I am analyzing video footage recorded during submersible dives. Like a census used to measure human populations, a visual fish census is conducted by scientists, who identify species of fishes seen in particular habitats and estimate the density, or abundance, per unit area for each species.

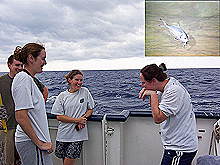
Christina Ralph (right) describes the beardfish she observed during her dive in the Johnson-Sea-Link II to her colleagues Kelly Filer, Zeb Schobernd, and Sarah Griffin. The beardfish (Polymixia nobilis – see inset) swim along the bottom with their barbels in constant contact with the sediment. The barbels act as sensory organs. Click image for larger view.
The art of counting fish
The first step in a visual fish census is to correctly identify the species. Identifying fish underwater in submersibles or from video footage can be a little tricky. You are not able to hold the fish in your hand and count or measure discriminating characteristics like fin rays or gill rakers (structures in the gills that filter food from the water). Also, fish seen underwater can look very different from dead or preserved specimens. Therefore, a variety of characteristics must be considered to identify fish underwater, including behavior, swimming styles, colors and patterns on the body, and size.
The next step of a visual census is to estimate the density (the number of fish seen for a particular species per unit area). To calculate density, the scientists set up timed transects along strips of reef. During an ideal transect, the submersible moves along an imaginary line on the reef, usually at a constant speed. These transects are videotaped with a camera that is mounted onto the submersible.
After the submersible surfaces, the scientists analyze the videotape. First, they count the number of fish seen during transects. Then, they calculate fish density by dividing the total number of fish seen for a particular species by the area or volume of water viewed. Volume is measured in cubic meters (fish swim in a three-dimensional space) and is determined by multiplying the transect length by the transect width and height.

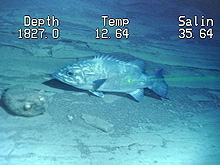
Two laser beams (seen as a red and green dot) from the submersible reflect off the wreckfish shown here. The dots produced by these lasers are 25 cm apart and can be used to estimate fish length and the area viewed by the camera. Click image for larger view.
We measure the transect width and height, using two laser beams that are mounted on the submersible’s camera and can also be seen on the videotapes. The space between these two beams represents a known distance from which we can calculate the two-dimensional area viewed (width and height of camera field). As the camera zooms in, the space between the lasers increases on the monitor, while the area viewed decreases. The reverse is true when the camera zooms out: the space between the lasers decreases while the area viewed increases. (These lasers can also be used to estimate fish length.)
Finally, we determine transect length from the track of the submersible relative to the ship, combined with position data from the Global Positioning Systems (GPS).
After determining fish density seen within a small area, scientists extrapolate to estimate total fish abundance in larger areas with similar habitats. Also, comparisons can be made between current density estimates and those from previous years to see how fish assemblages have changed over time.
An amazing submersible adventure
My first submersible mission began yesterday at 2 pm. I
was a little nervous (knowing that we would dive to over 600 m), but
my fears faded as my excitement welled. The first sight from the
sub porthole was endless clear, blue water. As we descended,
the light slowly filtered out and the shades of blue grew darker and darker.
Soon, we were surrounded by nothing but black water.
I peered out the porthole, not expecting to see anything in the blackness, but I was wrong. At first, I thought I saw little glints of light from reflections on the bubbles released from the sub, but these flashes were not bubbles at all. We were surrounded by a "solid snow" of jellyfish and other plankton that were bioluminescent (able to emit visible light) as they drifted through the water. What an amazing sight!

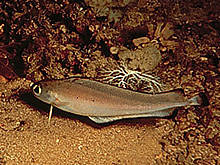
Laemonema are a type of morid cod with an elongate body and tapering dorsal and anal fins. Click image for larger view.
After 25 minutes of steady descent, the sub finally touched bottom. Strong currents caused us to drift over a mile from our intended touchdown site. Instead of rocky scarps, we were surrounded by flat terrain covered with sand and silt sediments and dotted with corals, brittle stars, and sea lilies. The light from the sub attracted hundreds of tiny red shrimp. We also saw several species of fish in the immediate area.
My favorite sight was the beardfish (Polymixia nobilis) that were swimming around. These fish have two barbels extending from their lower jaw; they use the barbels to feel and probe the sediment for food.
We also saw two species of shark and a species of the genus Laemonema, a type of morid cod with an elongate body and tapered dorsal and anal fins. We hope to collect a Laemonema specimen in order to identify accurately the species we are seeing in this area.
Unfortunately, our dive was cut short due to technical difficulties. We had to leave the bottom early. As we began our ascent, I realized that I now have even more questions about this amazing habitat and the organisms that live here. Hopefully, I will get another chance in the sub before this cruise is over. I can’t wait to see what new information and sights our next dive reveals!
Sign up for the Ocean Explorer E-mail Update List.


