Jason Chaytor, Geology Science Co-Lead, U.S. Geological Survey
Shannon Hoy, Mapping Expedition Lead, NOAA Ocean Exploration
Although the primary focus of the 2021 North Atlantic Stepping Stones expedition is to explore the numerous seamounts of the New England and Corner Rise seamount chains, the shift in cruise track due to weather at the beginning of the work provided the opportunity to explore other aspects of the North Atlantic seafloor. Using the mapping tools on NOAA Ship Okeanos Explorer, data are collected to produce high-resolution bathymetric maps of the seafloor similar to topographic maps common for areas on land, but under water, to measure layers and currents in the water column, and to look below the seafloor to see what is hidden, even from the cameras of remotely operated vehicle Deep Discoverer.
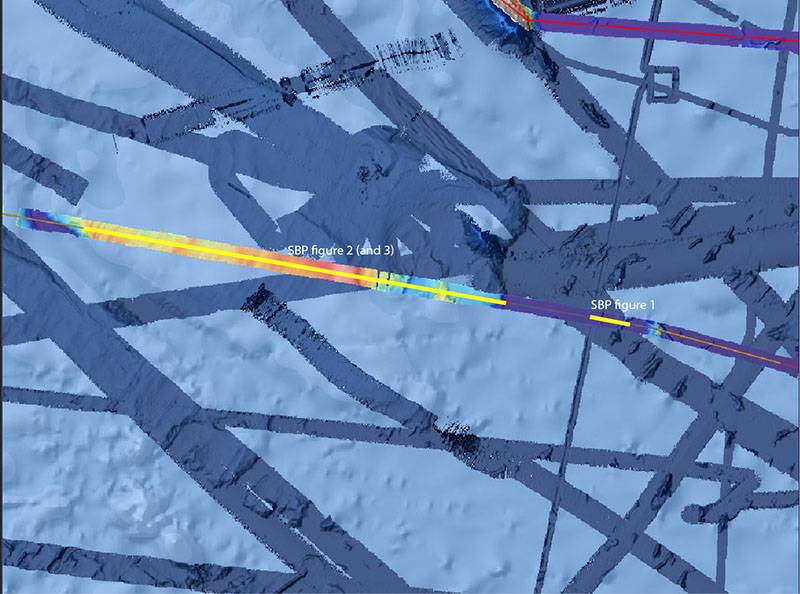
Mapping data collected during the transit from the location of our first dive (“North Bermuda Tritop”, just outside the Bermuda Exclusive Economic Zone) to the second dive (Congress Seamount - South), captured stunning views of the extraordinary sediment drifts of the northern Bermuda Rise (Figure 1).

Figure 1: Bathymetry collected during the transit from the site of Dive 01 to Dive 02 of the 2021 North Atlantic Stepping Stones expedition. Image courtesy of NOAA Ocean Exploration, 2021 North Atlantic Stepping Stones: New England and Corner Rise Seamounts. Download largest version (jpg, 740 KB).
In the northern Bermuda Rise region, the nearby Gulf Stream (surface current) and the presence of two different deep water masses (North Atlantic Deep Water and Antarctic Bottom Water; [Shipboard Scientific Party, 1998. Bermuda Rise and Sohm Abyssal Plain, Sites 1063 and 1064. In Keigwin, L.D., Rio, D., Acton, G.D., et al., Proc. ODP, Init. Repts., 172: College Station, TX (Ocean Drilling Program), 251–308. doi:10.2973/odp.proc.ir.172.106.1998 ]) create a dynamic ocean environment permitting sediments, transported from eastern Canada, to be deposited rapidly driven by deep recirculating gyres. On the seafloor, the dynamic nature of the sedimentation processes is seen in the development of a series of large sediment waves and scours around the bases of small ridges and seamounts. Because these sedimentation processes have been active for more than 2 million years (based on nearby Ocean Drilling Program (ODP) hole 1063), the records from the sub-bottom profiler on Okeanos Explorer captured remarkable images of thick (greater than 200 meters or 656 feet) layered (or laminated) sediments (Figure 2). Each of the layers seen in these images perhaps represent 40,000 to 100,000-year time periods (Figure 3).

Figure 2: Sub-bottom profiler data collected from the NOAA Ship Okeanos Explorer in between the first and second dives of the 2021 North Atlantic Stepping Stones expedition. The red box is the location of Figure 3. Image courtesy of NOAA Ocean Exploration, 2021 North Atlantic Stepping Stones: New England and Corner Rise Seamounts. Download largest version (jpg, 287 KB).

Figure 3: Sediment layers seen in the sub-bottom profiler data collected from the NOAA Ship Okeanos Explorer in between the first and second dives of the 2021 North Atlantic Stepping Stones expedition (red box in Figure 2). Image courtesy of NOAA Ocean Exploration, 2021 North Atlantic Stepping Stones: New England and Corner Rise Seamounts. Download largest version (jpg, 396 KB).
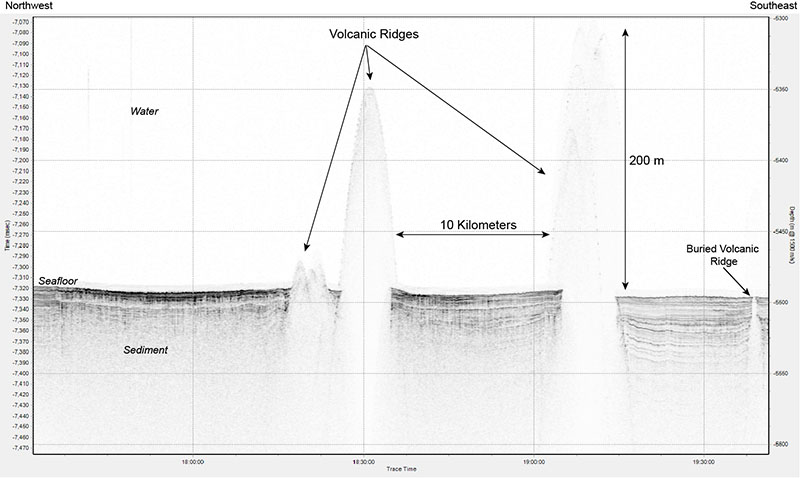
Additional sub-bottom profiler data collected along this transit line also shows the relationship of the exposed ridges and seamounts to the sediments, which accumulate around them. The nearly flat-lying sediment layers lie against the sides of the seamounts without bending, indicating that the seamounts were emplaced first and the sediments were deposited later, or in the example here, the sediments can also be thick enough to completely bury a ridge (Figure 4).

Figure 4: Sub-bottom profiler data of sediment layers adjacent to exposed and buried volcanic ridges collected from the NOAA Ship Okeanos Explorer in between the first and second dives of the 2021 North Atlantic Stepping Stones expedition. Image courtesy of NOAA Ocean Exploration, 2021 North Atlantic Stepping Stones: New England and Corner Rise Seamounts. Download largest version (jpg, 735 KB).
Published July 30, 2021.