
By Elaine Stuart, Senior Survey Technician NOAA Ship Okeanos Explorer
and Mashkoor Malik, Physical Scientist - NOAA Okeanos Explorer Program, OER
The data the Multibeam EM302 system on board the NOAA Ship Okeanos Explorer collects consists of bathymetry and backscatter; both are valuable in understanding the seafloor structure. Bathymetry provides information about depth of the seafloor while backscatter provides information about composition of the seafloor. Much of the data used for this cruise was collected during Leg 1 of EX1103 by design so that a preliminary plan could be made for Leg 2. Please see the Leg 1 Summary for a detailed account of the data collected in the Galapagos Spreading Center.
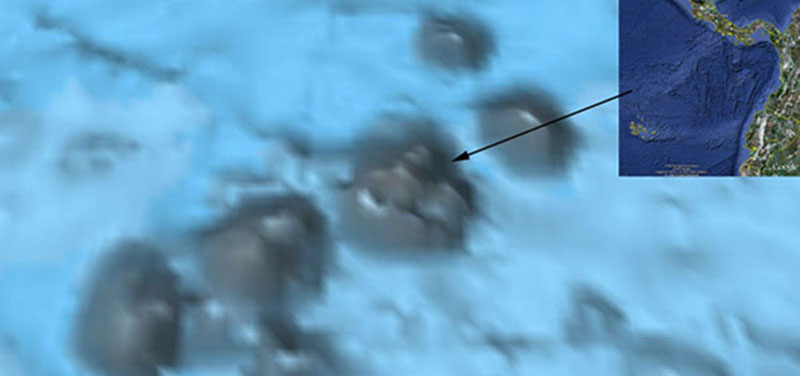
Overview in Google Earth (top right) of the area where the Paramount Seamounts are located. Underneath is an oblique view of Smith & Sandwell (SnS) data of the Paramount Seamount chain. An arrow points to the seamount of interest. Image courtesy of NOAA Office of Ocean Exploration and Research. Download image (jpg, 38 KB).
The first goal of Leg 2 for the ship was to collect data over one of the Paramount Seamounts and do a ROV dive as soon as possible after the multibeam data was processed. In planning lines over an area with no previous high resolution data, we rely on the combination of low resolution satellite and multibeam compilation by Smith & Sandwell (1997). In this case, there were no prior surveys done in the area, therefore the data only featured satellite data (see Figure 1). The satellite data made the seamount of interest appear as a ring of mounts with the highest point of approximately 500 meters. It was decided by the science party that the shoal area was the priority to be mapped, in particular along the ridge of the seamount and wherever the highest intensity backscatter was observed. Once the priority area was mapped, our data showed that this seamount was not a ring of mounds but one feature with a large flat top (see Figure 2). This shows the possible pitfalls of using low resolution satellite data to define features. Luckily the depth information was more reliable so the line spacing (based on depth) was accurate enough to cover the top of the seamount. Thus we were able to complete this survey in the shortest amount of time which was essential in giving the science party what they needed to find a suitable dive location for the ROV while meeting our time requirements.
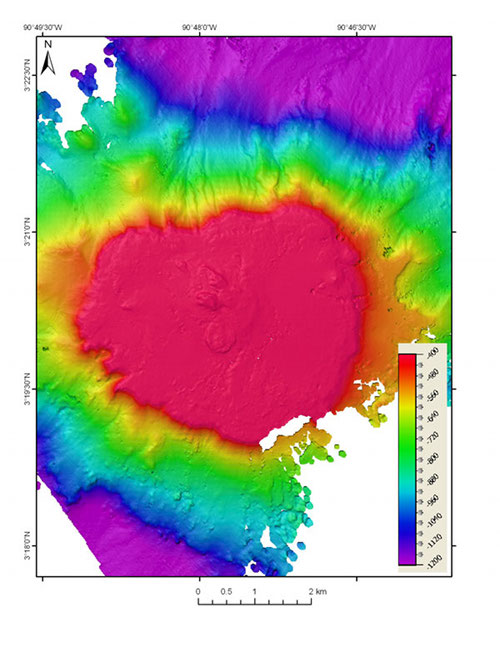
EM302 data of the tallest seamount in the Paramount Seamount chain. Image courtesy of NOAA Office of Ocean Exploration and Research. Download larger version (jpg, 1.5 MB).
After the data had been quickly processed, the science and ROV team leads looked over what had been collected and came up with a plan. One of the pre-agreed upon components of the dive was to start deep and then travel up the seamount and along the ridge. The backscatter collected showed where the hardest bottom could be found—which is differentiated in backscatter data by contrast. For our processing purposes, the data is shown with a grayscale color scheme where brighter colors equal harder bottom (see Figure 3). The multibeam showed a ridge that would serve perfectly for the ROV use in its climb to the summit of the seamount (see Figure 4). Both tools played a critical role in the dive location selection process.
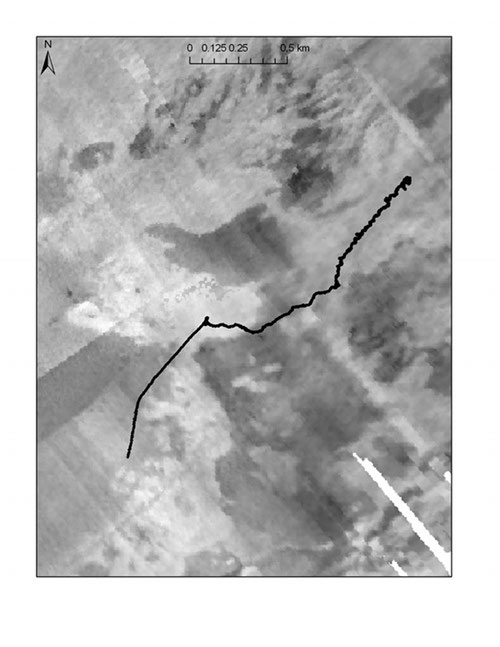
EM302 backscatter of the seamount showing ROV dive track (in black) which traveled from right to left up the seamount. Image courtesy of NOAA Office of Ocean Exploration and Research. Download larger version (jpg, 1.1 MB).
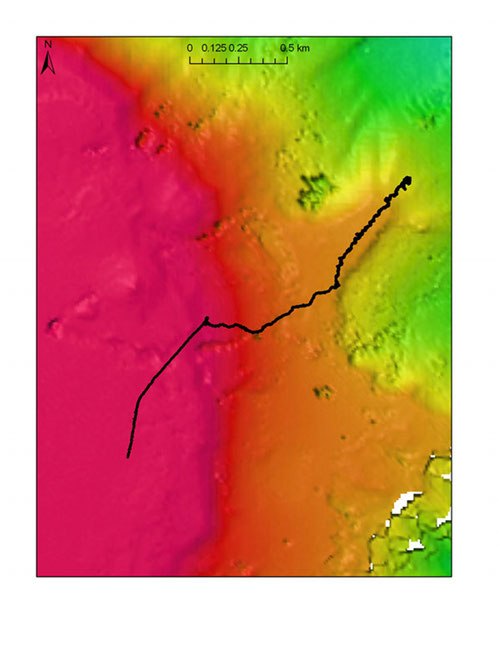
EM302 bathymetry data of the seamount where red represents the shallowest depths and green the deepest. Image courtesy of NOAA Office of Ocean Exploration and Research. Download larger version (jpg, 1.1 MB).
After the dive, the collected images of the site can serve an important role of ground-truthing the area. This serves a dual purpose of both showing how scientifically backscatter relates to what is there as well as being a good accuracy check of our system. Three main types of the seafloor delineated in backscatter images corresponded well with the ROV images collected at 10:32, 13:48 and 14:11 (shown in Figures 5).
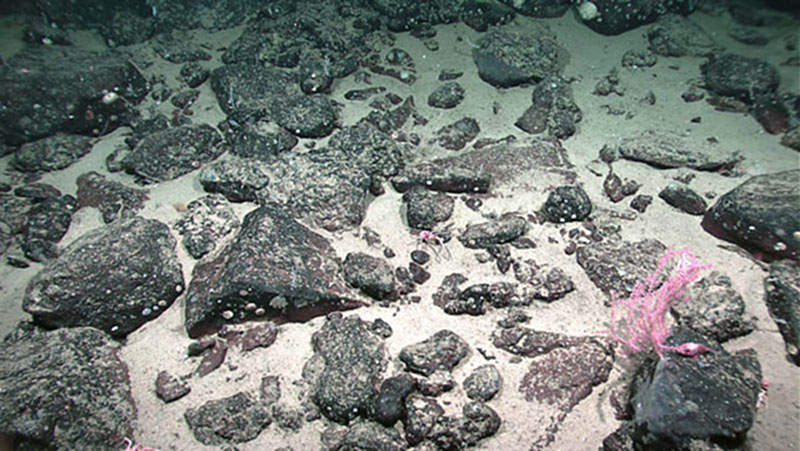
Figure 5.1: ROV image used to ground truth the backscatter observations. Image courtesy of NOAA Office of Ocean Exploration and Research. Download larger version (jpg, 1.8 MB).
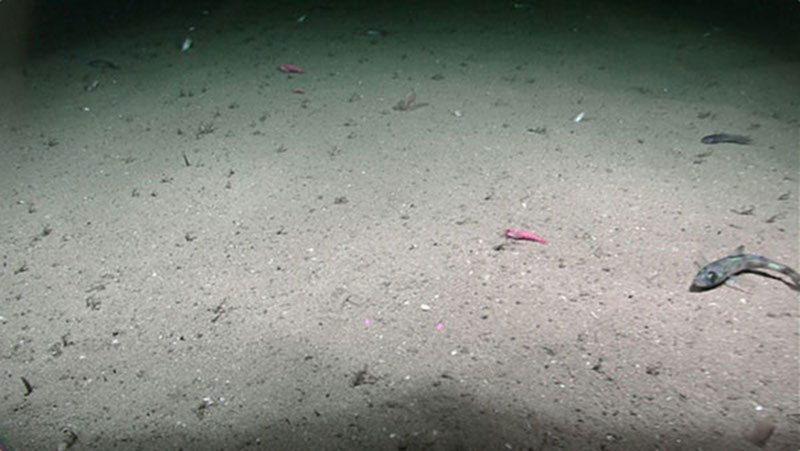
Figure 5.2: ROV image used to ground truth the backscatter observations. Image courtesy of NOAA Office of Ocean Exploration and Research. Download larger version (jpg, 468 KB).
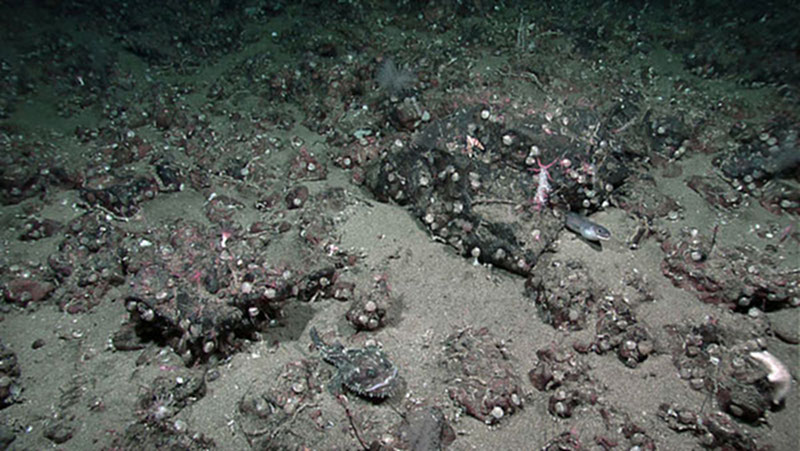
Figure 5.3: ROV image used to ground truth the backscatter observations. Image courtesy of NOAA Office of Ocean Exploration and Research. Download larger version (jpg, 1.6 MB).