By Adrienne Copeland - NOAA Office of Ocean Exploration and Research
Roland Brian - The Global Foundation for Ocean Exploration
March 14, 2017

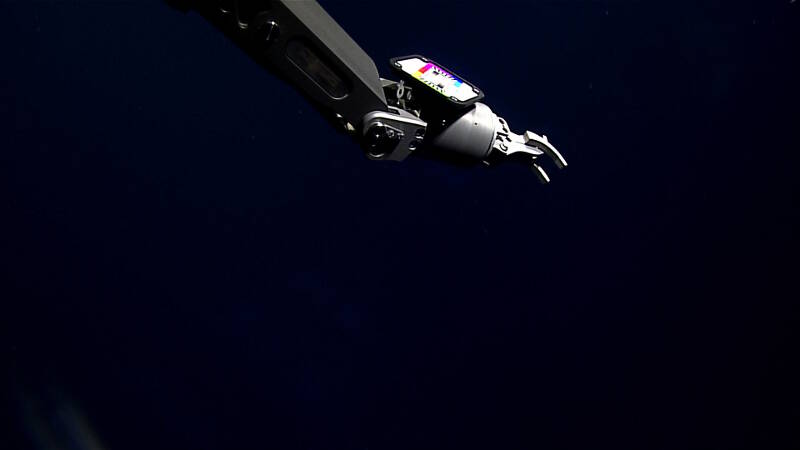
Here you can see the deployment of the left robotic arm of ROV Deep Discoverer with the Color Chip Chart on its wrist. Image courtesy of the NOAA Office of Ocean Exploration and Research, Discovering the Deep: Exploring Remote Pacific MPAs. Download larger version (jpg, 267 KB).
If you tune into the live feeds and start watching early, sometimes you will see this weird rectangular object with colors and black bars. Have you ever wondered what this is for? It is called a Color Chip Chart. This chart was custom designed by a Video Engineer from the Global Foundation for Ocean Exploration on board NOAA Ship Okeanos Explorer. It was designed to work with the remotely operated vehicle (ROV) Deep Discoverer’s (D2’s) left manipulator arm to precisely calibrate the primary ROV cameras, providing viewers at home with accurate colors of deep-sea life.

Even after color calibration, we still require further color corrections when we edit, as seen in these before and after images. You can see how much red is missing in the top image. This is due to the shorter distance that red light travels through water. By doing the daily calibration, we have a calibrated starting point to compare and work from. Image courtesy of the NOAA Office of Ocean Exploration and Research, Discovering the Deep: Exploring Remote Pacific MPAs. Download larger version (jpg, 2.2 MB).
This color correction, however, is only accurate to a certain distance. This distance is limited to the length of D2’s arm, which is about one meter. If the objects and/or critters are closer than this distance, they will appear too red; if farther, then they will appear too blue or purple. This phenomenon relates to the wavelength of the different color spectrums. Red’s wavelength is the longest, between 620 - 780 nanometers (10-9 meters), limiting the distance it travels both in air and water. Blue and purples, on the other hand, have the shortest wavelengths, permitting them to go much farther. You don’t have to go down thousands of meters like D2 to experience this phenomenon. You can experience it snorkeling along a shallow water coral reef. Without the help of the white lights of D2, the deeper coral along the reef will lose the vibrant reds and oranges you see near the surface.

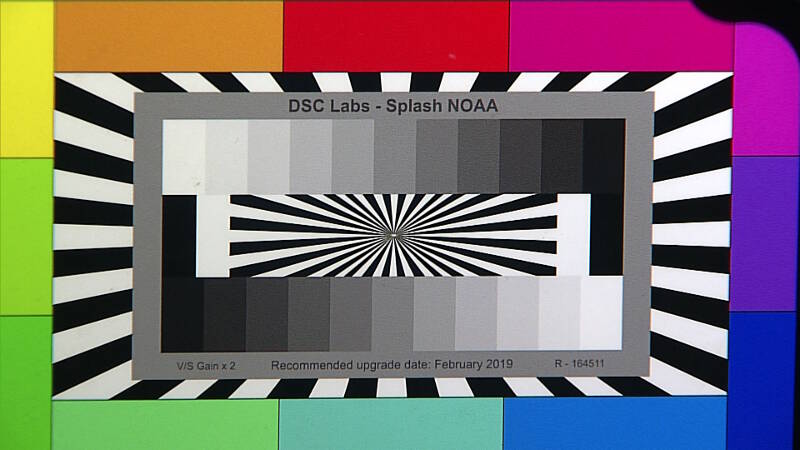
This is a close up of the Deep Discoverer’s Custom Color Chip Chart. Image courtesy of the NOAA Office of Ocean Exploration and Research, Discovering the Deep: Exploring Remote Pacific MPAs. Download larger version (jpg, 888 KB).
So how does the Color Chip Chart work with the white lights of D2? The Color Chip Chart has two primary portions that contain multiple sub sections. The first section is the interior rectangular containing the black and white or no color section. The center diagonal lines are for verifying focal precision or optimal focus of the camera on D2. The next outer two rows of 11 grey chips above and below the focal chart is called an Eleven Step Grey Chip chart. This portion allows the camera operators to precisely adjust the camera’s White Balance or Gain Controls, Gamma Controls, and Flare Controls. This also indicates if D2’s lights are equally distributed across the image. There are different brightness areas of the image and each area has its own color correction specifications. The next section of the chart, with the large diagonal lines, is a continuation of the optimal focus section of the chart and is easier to see at the widest zoom angle as part of the back focus check.

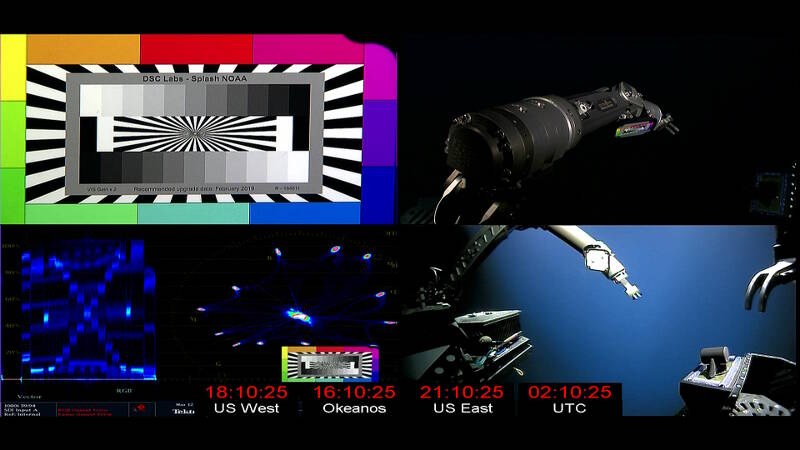
This Quad-Split image shows multiple cameras and windows that we use during the daily camera color calibration procedure. Image courtesy of the NOAA Office of Ocean Exploration and Research, Discovering the Deep: Exploring Remote Pacific MPAs. Download larger version (jpg, 763 KB).
Once the White Balance and Black Balance procedures are complete, the next portion of the Color Chip Chart comes into play. The outer portion of the Color Chip Chart is the Color Accuracy Area consisting of 12 color chips. These chips are used to ensure that the colors are the same as would be visible in normal sunlight.

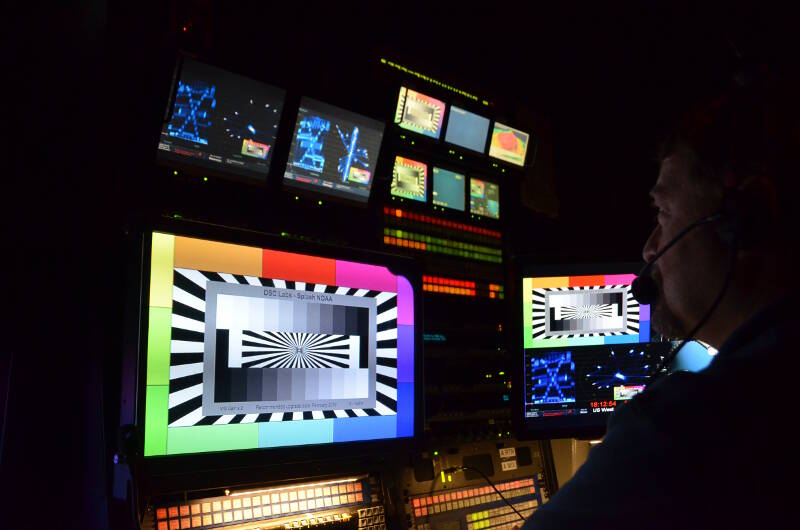
This is a look at the Video Shading Station during the Camera Color Calibration Procedure. Image courtesy of the NOAA Office of Ocean Exploration and Research, Discovering the Deep: Exploring Remote Pacific MPAs. Download larger version (jpg, 7.0 MB).
Remember that different colors transmit shorter distances based on their wavelengths? Well, the video engineers adjust the camera’s red and blue sensitivities relative to the green color and by mixing these colors, you see all the rest of the colors of the creatures and areas being viewed.
Once these steps are complete, we are able to produce the beautiful vibrant imagery that we have come to know and expect from the live feeds. White light normally does not penetrate to these depths. Because these vibrant images are not experienced by these animals in their daily lives in the dark abyss, one may wonder what purpose these vibrant colors serve. It has been suggested that use of reds and purples in the deep ocean might be a camouflage technique due to the short distance that the red wavelength travels in water. What do you think?