By Meagan Putts
June 6, 2018
Have you ever explored the ocean floor using Google maps? If you do, you will notice that the entire ocean is covered with features ranging from seamounts to fracture zones. Since less than 5% of the ocean floor has been directly mapped, you may be wondering where the data comes from that shows such a detailed picture of the ocean floor. The answer is satellites.
Satellites can do more than direct you to the nearest Starbucks; they can also measure the smallest variations in sea surface height and gravity across the earth’s surface. This helps us “see” through the waves and model the depth and shape of underwater features such as seamounts and trenches. However, this model lacks the accuracy and detail needed to plan deep-sea operations like remotely operated vehicle (ROV) dives and deploying landers that can collect data on the bottom. This is why multibeam sonar surveys are the first step in the process of exploring the deep ocean.
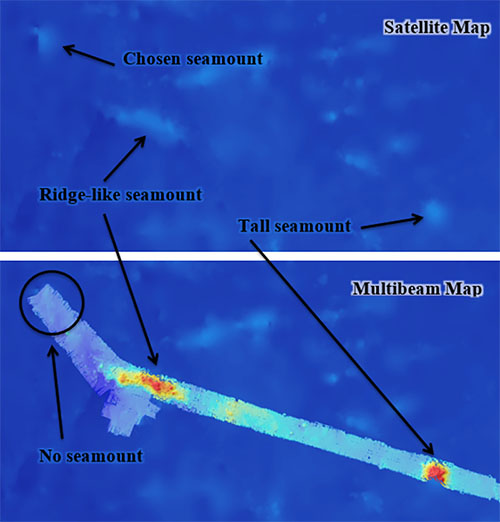
Since very little of the Clarion-Clipperton zone (CCZ) has been mapped in detail, we have been relying on the satellite data to select our survey sites. At our first survey site in Area of Particular Environmental Interest (APEI) 7, the satellite data accurately predicted position and height of our study seamount. Bolstered with confidence about the reliability of the satellite data, we planned our transit to map a seamount at our second survey site in the upper left quadrant of APEI 4, passing by all other possible seamount sites in the APEI. Along our track to the desired sampling location, we passed over one of the seamounts that we had considered in the process of selecting a sampling location. This seamount was in the exact position that the satellite data had predicted, very reassuringly, and the shape was quite conical, also as predicted. However, much to our surprise, it was over 1000 m taller than the satellite had predicted, raising some questions as to the true accuracy of our map. Would our study seamount also be so tall? If so, would we need to find a different location that would better fit the needs of the project? The next seamount feature we mapped along our way was a 58 kilometer long ridge-like seamount. It was exactly as advertised and was the cousin to the seamount sampled in APEI 7. Would our seamount, being closer to this location, be as accurately represented?
As we approached our intended sampling location, we were looking forward to seeing the seamount for the first time, wondering if it was going to be taller than expected like the first seamount, an exact match to the data like the second seamount, or possibly deeper and shorter than expected. Little did we know what we would actually find at the seamount site—an amusingly flat abyssal plain. Our carefully selected seamount was nowhere to be seen! Needless to say, we could not sample an invisible seamount. Fortunately, since we had mapped seamounts earlier in the day, the team could be confident in their decision to turn around and return to the ridge-like seamount just 50 miles south to commence our study of APEI 4.

In the satellite map, lighter blue areas indicate raised areas of the sea floor. The lighter the blue, the more likely it is a seamount. In the multibeam map, the track that the ship mapped during the transit from APEI 7 is overlaid over the satellite map. Red indicates depths shallower than 3,000 meters and dark blue indicates depths greater than 5,000 meters. Image courtesy of the DeepCCZ expedition. Download larger version (jpg, 206 KB).
We may never know why the satellite data predicted a seamount where there was not one. Perhaps it was an anomaly or a stitching problem between data sets? In any case, our experience is an important part of ground-truthing satellite data sets and reiterated to us the need for ocean exploration, especially when planning hypothesis driven studies in the deep sea.