By Astrid Leitner, PhD Student, University of Hawaiʻi at Mānoa
June 2, 2018

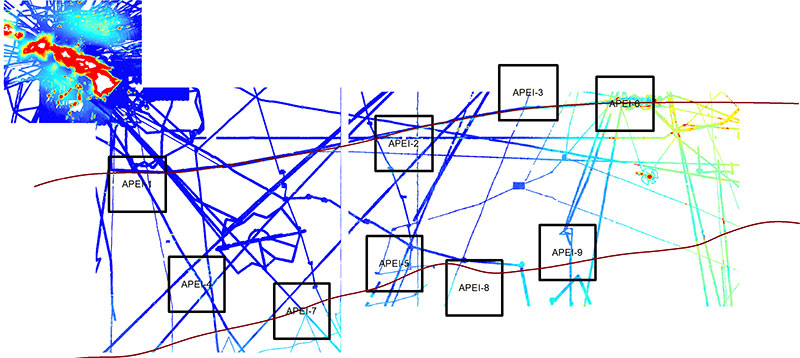
Figure 1: A map of the existing multibeam data from the CCZ with the main Hawaiian Islands included for reference. The Clarion and Clipperton fracture zones are sketched in grey as approximate boundaries for the CCZ. Image courtesy of the DeepCCZ expedition. Download larger version (jpg, 2.2 MB).
With all the buzz about deep-sea polymetallic nodule mining and with mining companies seeking mining exploration claims across the Clarion-Clipperton Zone (CCZ), one would think this region is reasonably well known. Our current map of the CCZ may therefore come as a bit of a surprise (Figure 1).
No, the lines you see stretching across this image are not scribbles – they are ALL of the publicly available mapping data from the region. Just compare what we know about the bathymetry around the main Hawaiian Islands in the top left corner of the map to the CCZ, and you will get a sense of how little we really know about the CCZ.
In fact, over 80 percent of our planet’s ocean is unmapped (ncei.noaa.gov). Though white spots on the map seem like a long-since-resolved problem of ancient explorers, 57 percent of our planet as a whole still remains unmapped! In contrast we have mapped nearly the entire surface of the moon at a pixel scale of about 328 feet (nasa.gov)! This lack of data becomes particularly important when we try to design an effective mining impacts management plan.

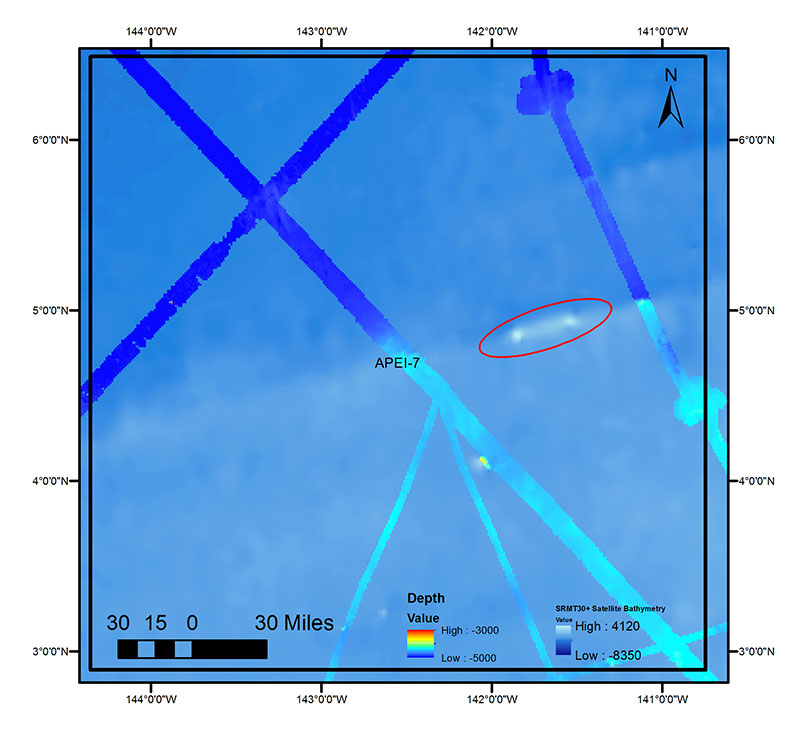
Figure 2: A map of APEI 7 with predicted bathymetry from satellite observation techniques as the background and all previously existing publically available bathymetry overlaid. Our seamount of interest is circled in red. Image courtesy of the DeepCCZ expedition. Download larger version (jpg, 1.1 MB).
This is why a crucial component of the work we are doing out here is mapping. Using the multibeam system aboard the R/V Kilo Moana, we are filling in some of the white spots on the map. Guided by pixelated estimates of bathymetry generated by satellites (this is similar to what you get when you look at the ocean in Google Earth; see Figure 2), we are mapping, exploring, and investigating three previously unsampled seamounts across the western CCZ. These seamounts are all within Areas of Particular Environmental Interest (APEIs) which are potential marine reserve areas. Understanding the bathymetry of the ocean floor is crucial for understanding the habitat within these regions, which helps us to evaluate their value as marine reserves.
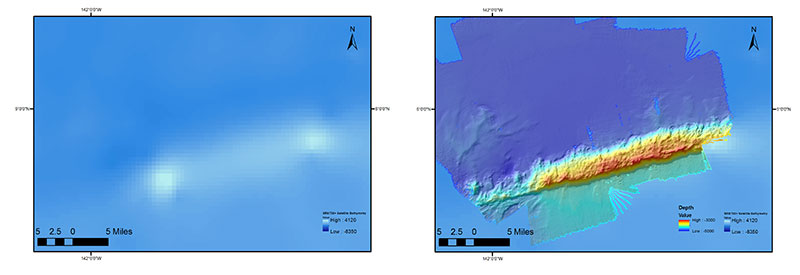
So far, we have mapped one seamount in APEI 7, which turned out to be an elongate ridge feature right atop the Clipperton fracture zone. The feature was visible on the satellite-predicted bathymetry and the estimated shallowest height was close to what was predicted, but instead of being two peaked summits with a deep saddle connection, the seamount turned out to be a long, wide ridge (Figure 3).

Figure 3: Before (left) and after (right) shots of the seamount of interest. The left map shows estimated bathymetry from satellite. The right area shows the multibeam data we have just finished gathering and processing over the same region. Image courtesy of the DeepCCZ expedition. Download larger version (jpg, 1.7 MB).
In fact, after a total of 14 hours of mapping on and around the seamount, we still haven’t reached the end! The abyssal plain to the north was amazingly flat at a depth of 4,780 meters. The depth never varied more than 50 meters across the whole plain sampling area! We could also see the flat, shallower, younger seafloor on the southern side of the seamount.
We are now leaving APEI 7, transiting up to APEI 4 to the northwest. This upcoming APEI is covered in seamounts and hills, so the transit mapping is sure to yield exciting new features. Stay tuned for more mapping discoveries!