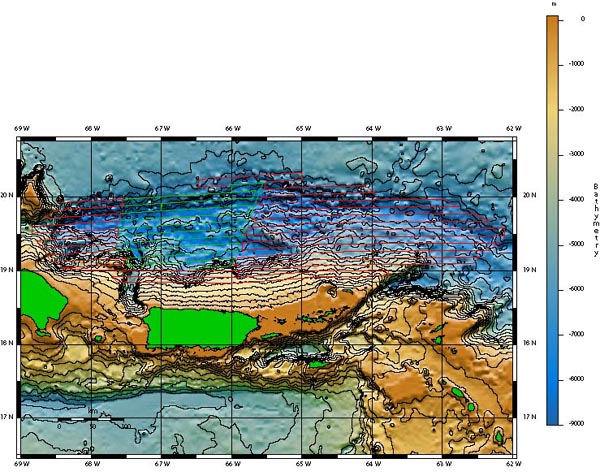
Tracklines of the multibeam bathymetry cruises. Green indicates data collected during September 2002 and red indicates data collected during February-March 2003.
NOTICE: This page is being retained for reference purposes only and is no longer being updated or maintained.


