
by Anna Lienesch, Oceanography Faculty Assistant, University of Maryland and NOAA National Centers for Environmental Information (NCEI)
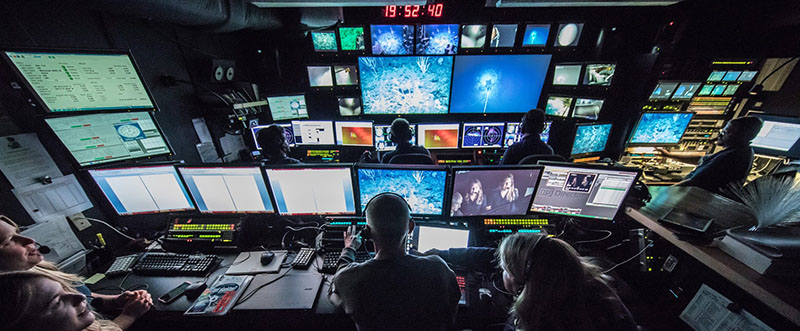
Science team inside the mission control room aboard NOAA Ship Okeanos Explorer during an ROV Dive. Image courtesy of the NOAA Office of Ocean Exploration and Research. Download larger version (jpg, 802 KB).
NOAA Ship Okeanos Explorer expeditions are most well-known for capturing never-before-seen footage of the deep sea and creating beautiful maps of the seafloor. But did you know that these videos and maps are only part of the data that is collected during Okeanos Explorer expeditions? At any given moment the Okeanos is underway, it is using a wide variety of instruments to measure many different properties about the sea and the sky. There are several types of data that are collected during an expedition, including navigational, geophysical, and oceanographic data, as well as physical samples and video data. To find out more about the equipment used and measurements taken aboard NOAA Ship Okeanos Explorer, keep reading!
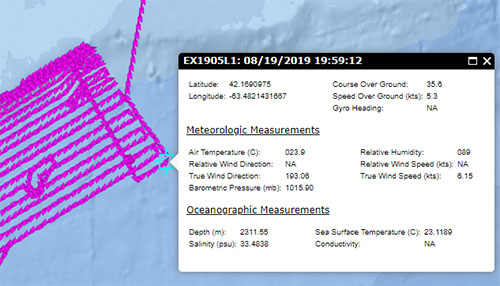
Near real-time data are sent to shore and publicly accessible via the Okeanos Atlas, like this ship track observation from the first leg of the Deep Connections 2019 expedition. Image courtesy of NOAA National Centers for Environmental Information. Download larger version (jpg, 236 KB).
The position of the Okeanos Explorer is always known. Much like your cell phone knows your location, the ship uses that same GPS technology to place its location, but it has more sophisticated instruments with better accuracy. In order for all the scientific data being collected to be interpreted and have a spatial context, the location and movement of the ship needs to be tracked and documented by onboard systems. Measurements may be recorded many times every second, or averaged over a longer time, depending on what they are used for. These navigational data are sent in near real-time to shore where they are used to update weather services, as well as NOAA’s National Centers for Environmental Information’s (NCEI) NOAA Ocean Exploration Data Atlas, and are then logged in NCEI’s long-term archive after each expedition.
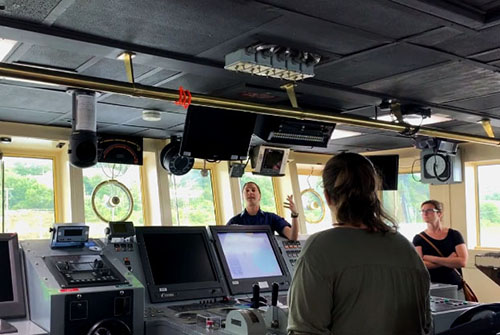
Operations Officer Lieutenant Rosemary Abbitt gives a tour of the bridge of NOAA Ship Okeanos Explorer during the August 23, 2019 ship tours in Dartmouth, Nova Scotia. Image courtesy of the NOAA Office of Ocean Exploration and Research, Deep Connections 2019. Download image (jpg, 172 KB).
The ship is equipped with a suite of GPS antennas which record the vessel’s geographic position (latitude & longitude) over time, and thereby keep track of its path and speed. It also has two gyrocompasses that measure true North and keep it headed in the right direction. Additionally, the ship is equipped with a Position and Orientation System for Marine Vessels (POSMV), which records the vessel’s position and movement in the water (this is called attitude and is composed of four measurements: pitch, roll, heave, and yaw). Navigational data collected by all these instruments can account for about 0.1-2% of the total volume of data that is collected on a typical expedition.
To access Okeanos Explorer navigation data check out the NOAA Shiptracker, or the NOAA Ocean Exploration Data Atlas. These navigational data are not just important for keeping track of the ship’s whereabouts, but are also essential for putting all other data types collected on an expedition into spatial context.

NCEI's composite multibeam hillshade mosaic shows the depth gradient of the seafloor off of the Mid-Atlantic region of the United States. Image courtesy of NOAA National Centers for Environmental Information. Download larger version (jpg, 238 KB).
One of the main objectives of NOAA Ship Okeanos Explorer is mapping the seafloor and the water column within the United States economic exclusion zone (EEZ). Mapping data is collected by a suite of sonars, including an EM 302 multibeam echosounder, a Kundsen sub-bottom profiler, and EK 60/80 split-beam sonars, all of which send sound beams downward through the water column towards the seafloor. Because the ship will always move with the waves, even when stopped, these instruments must use the navigational data described above to send the sound in the right direction! All the systems aboard the Okeanos rely on each other in some way.
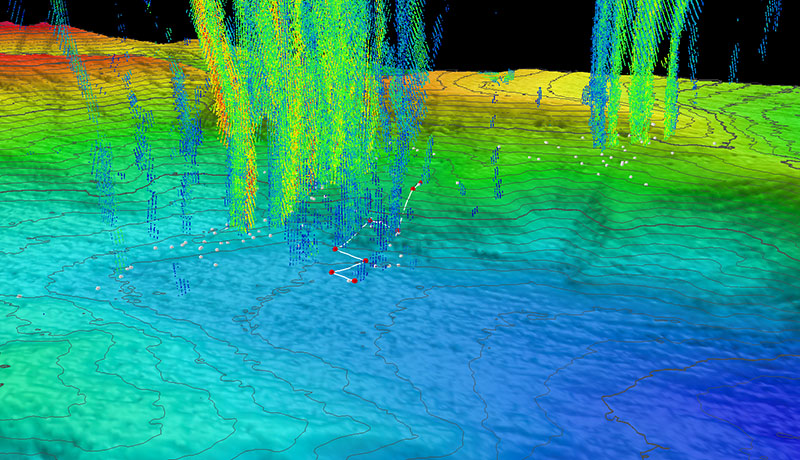
Three-dimensional perspective of a ROV Deep Discoverer dive track (white lines) and waypoints (red points) with superposed water column bubble plumes (multi-colored point clouds) imaged by NOAA Ship Okeanos Explorer during a previous mission. Methane bubble plumes at Norfolk Seeps have been imaged rising over 900 meters (2,950 feet) above the seafloor in previous surveys. Bathymetric data were collected with the Okeanos Explorer multibeam sonar and are contoured at 10-meter (about 3-feet) intervals. The locations of previously identified seeps are indicated with white points. All data are shown at two times vertical exaggeration. Image courtesy of the NOAA Office of Ocean Exploration and Research, Windows to the Deep 2019. Download larger version (jpg, 1.6 MB).
The bottom of the ocean is still largely a mystery, so scientists investigate how deep the seafloor is, what it looks like, and its composition. The geophysical data collected by the ship include raw multibeam, which the mapping team processes to create beautiful products that illustrate the morphology and depth of the seafloor like this Multibeam Mosaic. Other mapping data collected by NOAA Ship Okeanos Explorer include (1) multibeam backscatter data that indicate the relative hardness of the seafloor; (2) sub-bottom data, which provide details on what the substrate looks like up to 80 meters (264 feet) below the seafloor; and (3) split-beam backscatter data, which create a composite profile of the water column and can show features within it like fish and gas seeps! These data account for close to 98% of the total data volume collected on a mapping expedition, and around 5% for an expedition that includes remotely operated vehicle (ROV) operations.
To access NOAA’s collection of geophysical data, check out NCEI’s Bathymetric Data Viewer, Water Column Sonar Data Map, and the indexed geophysical Data and Products Access page.
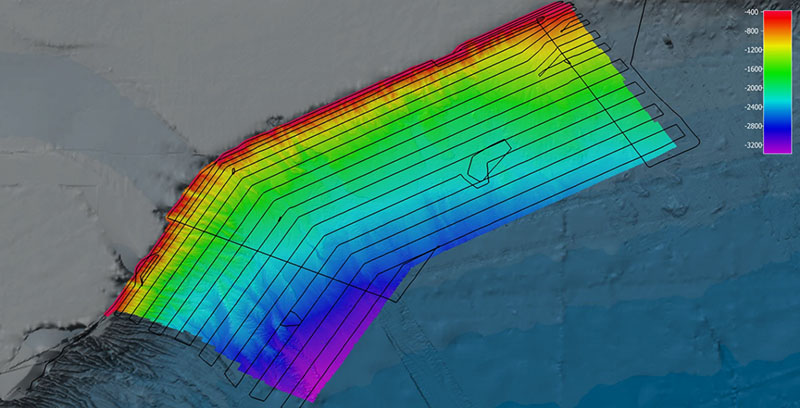
Mapping teams create a composite map that shows the depth of the seafloor and the track lines from the ship after each expedition. Image courtesy of the NOAA Office of Ocean Exploration and Research, Deep Connections 2019. Download larger version (jpg, 737 KB).
The atmosphere and the ocean are constantly interacting with one another, and these interactions can easily be seen in wind creating waves, water column mixing, and ocean circulation. Because the biology, geology, chemistry, and physics of our oceans are influenced by the characteristics of water, NOAA Ship Okeanos Explorer is dedicated to measuring the oceanographic properties around the ship and ROVs to better understand how these parameters affect one another. For example, sound velocity in water, which is a geophysical trait, is primarily dependent on the temperature and salinity of the fluid it’s passing through, which are oceanographic traits.
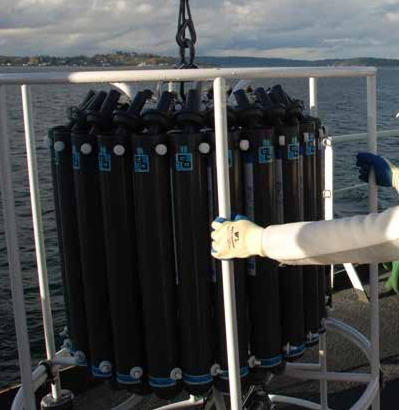
Scientists aboard NOAA Ship Okeanos Explorer bring the deployable CTD rosette back on board after sending it to the seafloor. A CTD probe attached to the rosette collects continuous conductivity, temperature and depth information throughout the water column while deployed. Additionally, the Niskin bottles attached to the rosette can be triggered to collect water samples at specific depths. Image courtesy of NOAA. Download (jpg, 137 KB).
Many of NOAA Ship Okeanos Explorer’s oceanographic instruments are either mounted onto the hull of the ship, or attached to the ROVs (Deep Discoverer (D2) and Seirios). Water density is one of the main characteristics that influences water circulation in the deep sea. Two of the most commonly measured properties of water are temperature and salinity, which together determine its density. Both ROVs are equipped with a CTD, which measures water Conductivity (a proxy for salinity), Temperature, and pressure (a proxy for Depth). The Okeanos itself also has a deployable CTD rosette, which can be deployed to measure CTD and collect water samples across the water column, as well as a ship-mounted thermosalinograph, which measures conductivity and temperature below the ship’s hull. To measure temperature throughout the water column we also use expendable bathythermographs (XBTs), small probes that are dropped over the side of the ship and which relay the temperature back to ship through a thin copper wire as the probe falls through the water column.
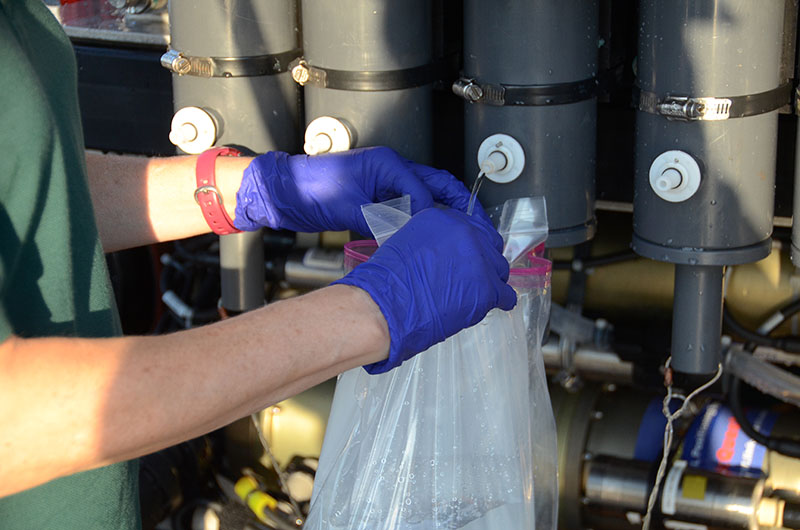
Once aboard NOAA Ship Okeanos Explorer, water collected in Niskin bottles during the Windows to the Deep 2018 expedition Dive 04 is transferred to sterile containers for later eDNA processing. Image courtesy of the NOAA Office of Ocean Exploration and Research, Windows to the Deep 2018. Download larger version (jpg, 8.5 MB).
Other instruments used for oceanographic data collection aboard the Okeanos include (1) a flow-through fluorometer, which measures chlorophyll in surface waters (a proxy for photosynthetic plankton), (2) two Acoustic Doppler Current Profilers (ADCP) that measure the speed and direction of ocean currents up to 1,000 meters (3,281 feet) below the surface, (3) dissolved oxygen sensors that provide oxygen concentrations within the seawater.
Additionally, NOAA Ship Okeanos Explorer also is equipped with instruments that measure meteorological data above the sea surface, such as wind speed, wind direction, air pressure, air temperature, and relative humidity. Together, these oceanographic and meteorological data variables help characterize the physical properties of the ocean and the atmosphere. These data can account for about 0.5-1% of the total volume of data collected on an expedition.
To access NOAA’s oceanographic data, check out NCEI’s World Ocean Atlas (WOA), World Ocean Database (WOD), Global Ocean Currents Database, or the indexed oceanographic Products and Services page.
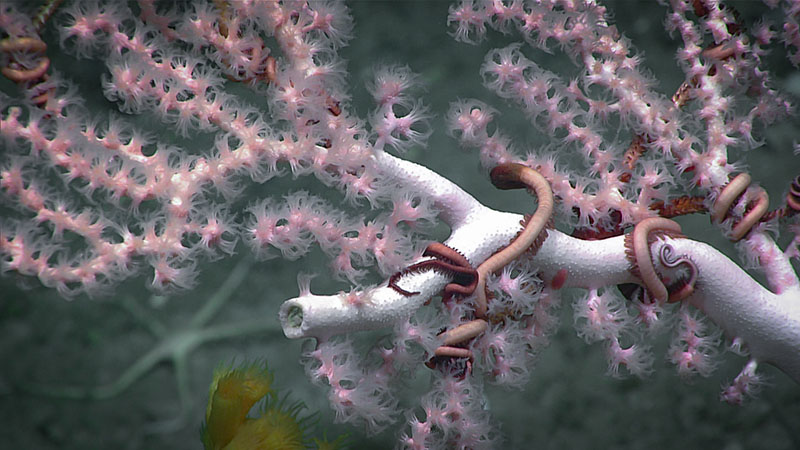
A bubblegum coral with associated snake stars documented during Dive 01 in Gully Canyon. Image courtesy of the NOAA Office of Ocean Exploration and Research, Deep Connections 2019. Download larger version (jpg, 1 MB).
Other than examining water column and seafloor backscatter data for schools of fish or potential coral mounds, some of our data is derived from physical specimens that are collected by the ROVs. ROV Deep Discoverer is equipped with two robotic arms that it uses to collect samples, as well as a new suction sampler that can collect some of the more delicate samples, like jellies. After collection, biological or geological samples are brought to the surface where extensive information on each specimen is collected and logged, such as its identification (when known), size, shape, weight, color, and identifying features. For biological samples, we even take a small subsample to send off for DNA analysis. Then we forward the remaining biological sample to the Smithsonian Natural History Museum for identification and archiving, whereas geological samples are sent to the Marine Geology Repository at Oregon State University for archival.
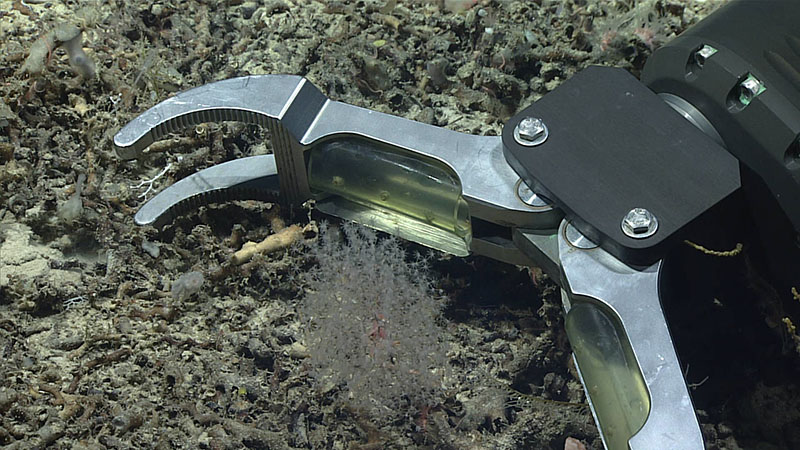
An octocoral and squat lobster associate that were collected on Dive 05 of the Windows to the Deep 2019 expedition. Remotely operated vehicle Deep Discoverer’s manipulator arm is visible as it goes to make the collection. Image courtesy of the NOAA Office of Ocean Exploration and Research, Windows to the Deep 2019. Download larger version (jpg, 1.2 MB).
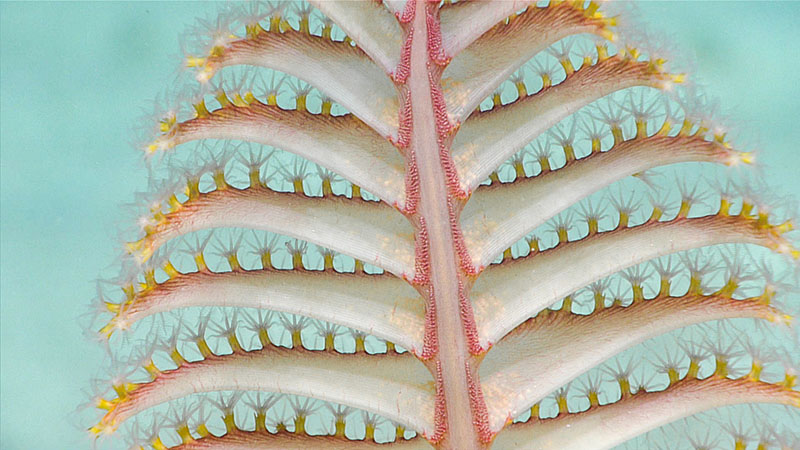
This sea pen was seen during Dive 2 of the Océano Profundo 2018 expedition. Image courtesy of the NOAA Office of Ocean Exploration and Research, Exploring Deep-sea Habitats off Puerto Rico and the U.S. Virgin Islands Download larger version (jpg, 1.2 MB).
However, the majority of the data collected during an ROV expedition are videos and images taken by cameras mounted on the ROVs D2 and Seirios. Because the camera systems on our ROVs collect some of the highest-resolution imagery available, they collect over 1 gigabyte (GB) of video each MINUTE! This data gives the public and scientists an exclusive look at the habitat and behavior of creatures along the seafloor and throughout the water column. Video is annotated by scientists both during and after each dive, so it can be referenced in the future. We have been able to create some amazing products from this data like the NOAA Office of Ocean Exploration and Research’s (OER) Benthic Animal Guide. ROV video and photo data can account for about 95% of the total volume of data collected on an ROV expedition.
To access the NOAA’s video data and physical samples, including those from the Okeanos Explorer, check out the OER Video Portal, Okeanos Sample Access page, and the ROV Data Access tab within each cruise of the NOAA Ocean Exploration Data Atlas.
The combined volume of data collected during a NOAA Ship Okeanos Explorer expedition can vary. During our latest Windows to the Deep 2019 expedition, the mapping leg of the cruise collected over 446 GB of data. This is like streaming Journey’s “Don’t Stop Believin’” 46,954 times, or nonstop for over four and a half months. During the ROV leg of the cruise, we collected over 17,300 GB of data. This is like listening to that same song 1,828,754 times, or nonstop for over 14 years, 9 months, 1 week, and 6 days! To learn more about the instrumentation aboard the Okeanos, please visit the Mission Capabilities page.
The high quality and large volume of data collected on every NOAA Ship Okeanos Explorer mission showcases the dedication and hard work of our team. Data collected on the ship follow federal open-access data standards and are publically available shortly after an expedition ends. This ensures the delivery of reliable scientific data needed to identify, understand, and manage key elements of the ocean to anyone that needs it. We are fortunate to generate such large quantities of high-quality data by working at the frontier of data stewardship—it sure beats listening to the same song on repeat for years!
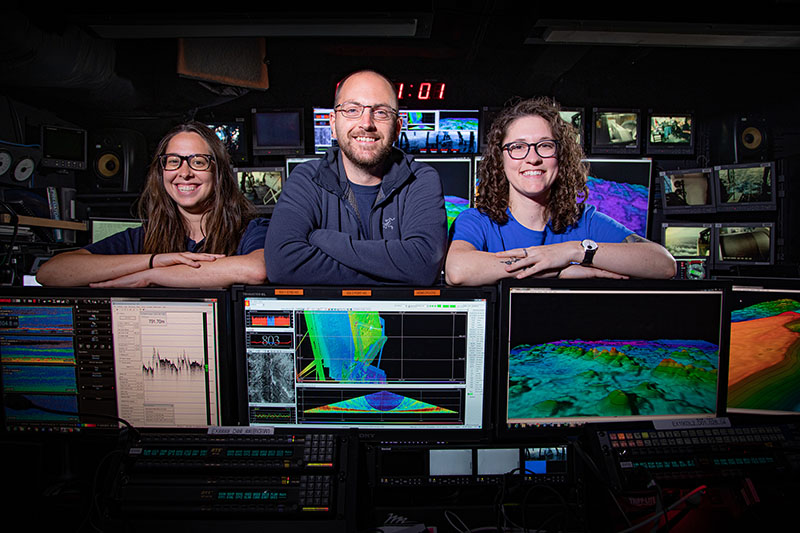
Mapping team of Windows to the Deep 2019 expedition inside the mission control room aboard NOAA Ship Okeanos Explorer. Image courtesy of the NOAA Office of Ocean Exploration and Research, Windows to the Deep 2019. Download larger version (jpg, 4.3 MB).