By Kody Kramer, Geologist - Bureau of Ocean Energy Management
April 12, 2014

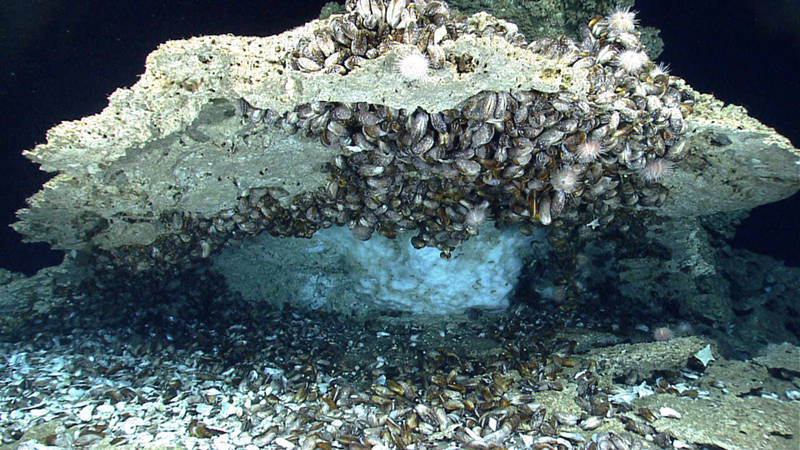
This site had a fantastic “amphitheater of chemosynthetic life.” Here we saw bathymodiolus mussels, methane hydrate or ice, and ice worms. There were also a number of sea urchins, sea stars, and fish in this area. Most impressive about this ledge was large accumulation of hydrates under the ledge as well as the large collection of mussels hanging upside down and a group of mussels that hung down off the ledge. Image courtesy of the NOAA Office of Ocean Exploration and Research, Exploration of the Gulf of Mexico 2014. Download larger version (jpg, 1.8 MB).
It’s a wonderful feeling when the research we do in the office is verified out in the field. I’m a geologist at the Bureau of Ocean Energy Management (BOEM) in New Orleans, and one of my duties is to find spots on the seafloor of the Gulf of Mexico which may be naturally seeping oil and gas.

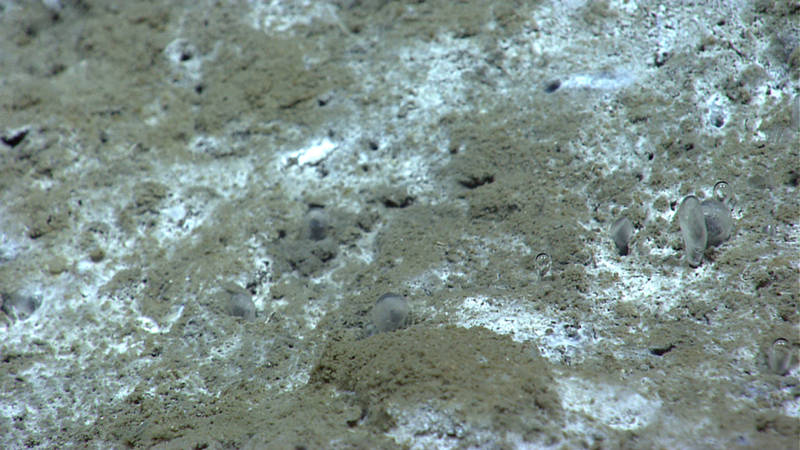
One of the best parts of the dive was when we saw a number of methane bubbles rise slowly enough from the sea floor that they developed a “crust” of hydrates. A number of scientists have hypothesized that this happens when there are the right seafloor conditions, but to the best of our knowledge this was the first time this phenomena was captured on video. Needless to say our science team was very excited about this discovery. Image courtesy of the NOAA Office of Ocean Exploration and Research, Exploration of the Gulf of Mexico 2014. Download larger version (jpg, 1.5 MB). Video highlights from Dive 01.
Bacteria in the seafloor mud feast on some of the chemical compounds from the leaking oil and gas, and the chemical byproduct of their feast forms a type of rock called authigenic carbonate. If the seep has been active long enough to form a carbonate wider and thicker than about 30 feet, I can indirectly see that outcrop on my computer screen via three-dimensional (3D) acoustic data , which is like a snapshot of a 3D cube of the geologic layers of Earth.
To visualize deep layers that may hold oil and/or gas reservoirs, energy companies shoot sound (a.k.a. seismic or acoustic) pulses down through the water of the Gulf of Mexico, penetrating miles into the Earth. The sound waves bounce back to recorders called hydrophones, and through sophisticated computer processing, the recorded sound waves give a “picture” of the geologic layers.

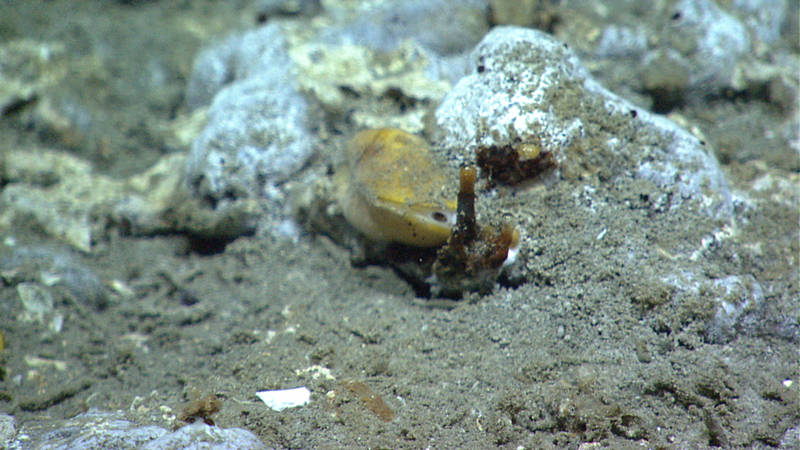
As ROV Deep Discoverer (D2) explored a dive site with a number of methane seeps, D2 imaged something truly exciting—a potential hydrate tube with both oil and gas bubble seepage. Image courtesy of the NOAA Office of Ocean Exploration and Research, Exploration of the Gulf of Mexico 2014. Download larger version (jpg, 1.8 MB). Video of oil and gas bubbles rising..
The first geologic feature recorded on this 3D seismic data is, of course, the seafloor. The parts of the seafloor which are harder, i.e., authigenic carbonates above oil and gas seeps, reflect the sound waves more strongly compared to the surrounding soft mud. Conversely, areas of the seafloor where the mud is charged with natural gas return a weaker acoustic signal to the geophone than the surrounding mud.
In the office, we draw outlines around these hard and gassy features on our seafloor maps because they support diverse communities of living organisms, besides bacteria, which feed on the seeps. Because of the sensitivity of the organisms at those sites, some of which can live longer than 200 years, BOEM protects these areas from oil industry activities.
The seismic data we review doesn’t show us an actual picture of the seafloor; we can only make a highly educated speculation that hardgrounds or seeps exist in a particular area based on the strength or weakness of the returning sound pulse. When we finally physically visit and film these locations with a remotely operated vehicle, it’s very gratifying to have our methodology verified. This is especially true at today’s dive in Garden Banks block 648, where seeps and carbonates were abundant just as our work predicted.

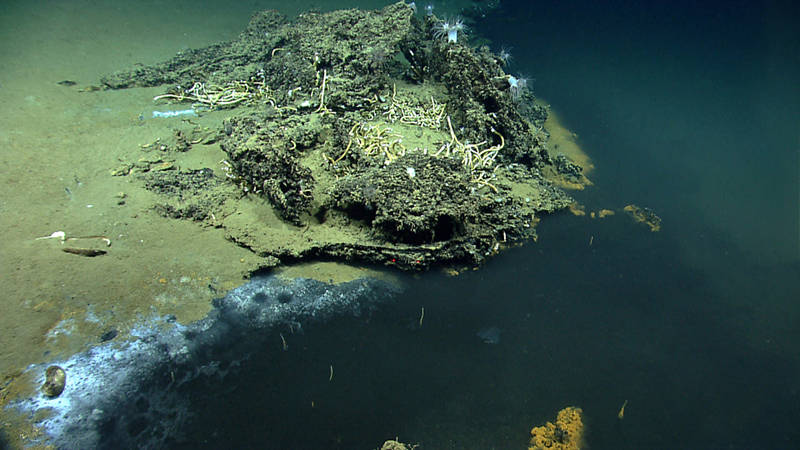
On Dive 02 of the 2014 Gulf of Mexico Expedition, ROV Deep Discoverer found an interesting brine pool. Brine seeps are common in the Gulf of Mexico, but brine pools of this size are not common (up to 10 meters wide and ~100 meters long). They are caused by seepage from salt bodies below the surface sediments and often are associated with hydrocarbon seeps. Around the shores of this brine pool we found anemones, fish, corals, sea stars, crustaceans, and tube worms. Pictured here are tube worms and anemones on a carbonate outcrop next to the brine pool. Image courtesy of the NOAA Office of Ocean Exploration and Research, Exploration of the Gulf of Mexico 2014. Download larger version (jpg, 1.8 MB).
BOEM has mapped over 25,000 of these speculated sites in the Gulf of Mexico since 1997, but carbonates and seeps are not the only fascinating phenomena we see using 3D seismic. In our database we’ve also identified subsea sand fans, exposed Jurassic salt on the seafloor, sediment slumps, methane hydrate deposits (just like under the carbonate overhang from today’s dive), sediment rivers being expelled out of the seep sites, pock marks, and mud volcanoes.
You can find further information and download our library of seismic anomalies, updated twice per year and in shapefile format, from the BOEM website at: http://www.boem.gov/Oil-and-Gas-Energy-Program/Mapping-and-Data/Map-Gallery/Seismic-Water-Bottom-Anomalies-Map-Gallery.aspx
Now go explore!