By Amanda Evans, Gray & Pape, Inc.
How do you look for something you can’t see? Working in the northwestern Gulf of Mexico, the river valleys and channels that we want to find and map offshore have been filled to the top with sediment. They aren’t visible from the seafloor. The seafloor itself, with some exceptions, is smooth, sloping, and featureless. Since the river valleys and channels aren’t visible to the naked eye, we use different remote-sensing tools to look underneath the surface.
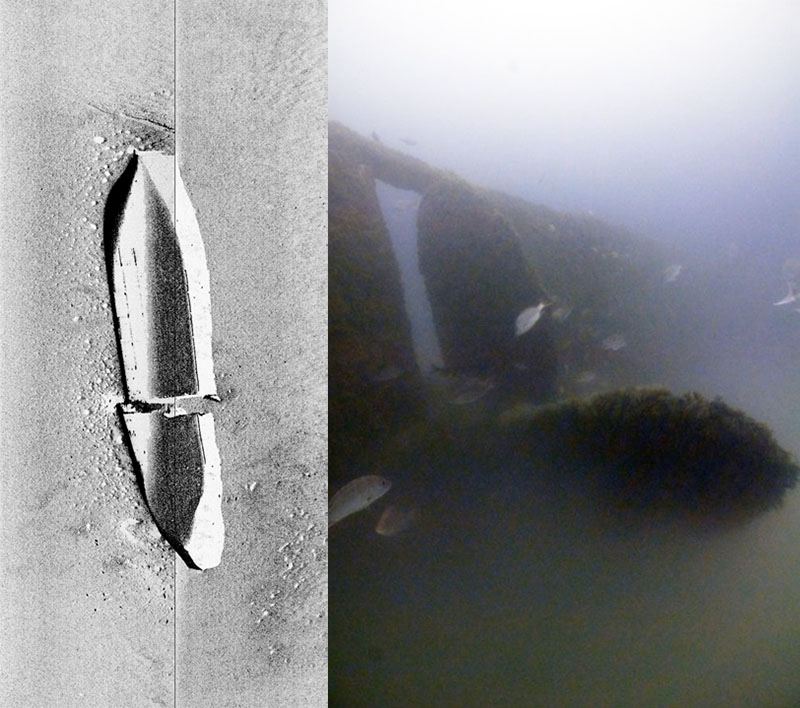
Remote-sensing technologies are simply another way of looking at the world around us. For this project, we’ve used acoustic sensors that penetrate through the seafloor to create a vertical profile of the different sediment layers underneath. Acoustic sensors include all different types of sonar systems, including common fish finders, multibeam echsounders, side scan sonar, and subbottom profilers. The thing they have in common is that these tools use sound to produce an image. Why sound? Because sound can travel long distances underwater. It travels farther and faster through water than light (Figures 1A and 1B).

Figures 1A and 1B: A shipwreck in 24 meters (80 feet) of water in the northwestern Gulf of Mexico was imaged using side-scan sonar (left); photographs taken by divers of the same wreck were obscured by lack of light and sediment in the water column (right). Images reproduced from Evans et al. 2013. Download larger version (jpg, 386 KB).
An acoustic sensor includes a sound source and a receiver, typically within one housing or shell. The transducer, the part of the sensor in the water that creates the noise, is either pointed straight down at the seafloor (like a fish finder, fathometer, singlebeam echosounder, or subbottom profiler) or out at an angle (like a side scan sonar or multibeam echosounder). Once emitted, the noise will either hit an object, creating an echo that bounces back to the receiver, or continue traveling away from the source. The receiver records both the amount of time it takes to hear an echo and the strength of the returned signal, or how much of the original signal is reflected back to the sensor (referred to as “backscatter”).
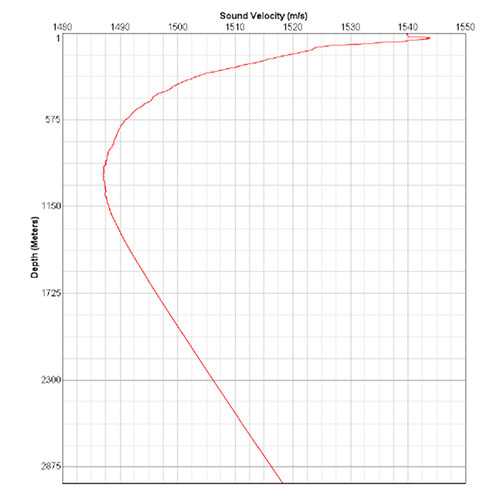
The actual speed of sound in saltwater depends on the salinity of the water, the temperature throughout the entire water column, and the density of the water (Figure 2).

Figure 2: A velocity cast shows the actual speed of sound throughout the entire water column, as changes in salinity, temperature, and density alternately increase and decrease velocity. Data courtesy of Echo Offshore. Download larger version (jpg, 148 KB).
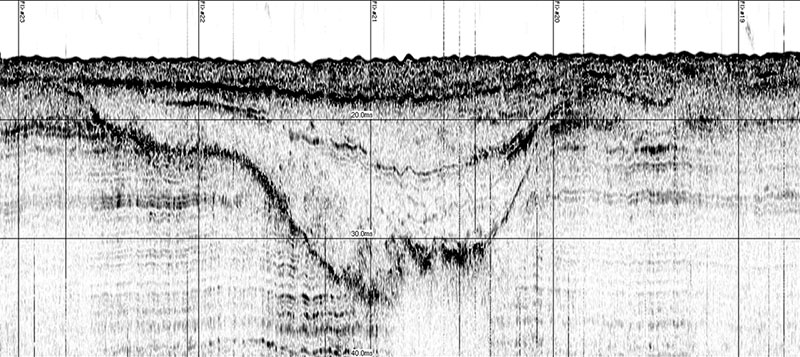
On average, the speed of sound in saltwater is 1,500 meters per second (4,921 feet per second), but this is the amount of time it takes the sound to leave the transducer and return to the receiver (also called two-way travel time). Generally speaking, the harder and denser a surface, the stronger and faster the returned echo. Mathematical formulas and computer algorithms are used to translate the speed of sound and the strength of the returned signal into an image. In the case of a side scan sonar, this creates an image of the seafloor. For a subbottom profiler, this creates a two-dimensional image of the seafloor and some of the different sedimentary structures below (Figure 3).

Figure 3: A sub-bottom profile of a buried river channel. Image reproduced from Evans 2016. Download larger version (jpg, 542 KB).
On average, the speed of sound in saltwater is 1,500 meters per second, but this is the amount of time it takes the sound to leave the transducer and return to the receiver (also called two-way travel time). Generally speaking, the harder and denser a surface, the stronger and faster the returned echo. Mathematical formulas and computer algorithms are used to translate the speed of sound and the strength of the returned signal into an image. In the case of a side scan sonar this creates an image of the seafloor. For a subbottom profiler, this creates a 2-D image of the seafloor and some of the different sedimentary structures below (Figure 3). By using sound, we can record a cross section of the seafloor below us, allowing us to image river valleys and channels that are invisible from the seafloor.
Evans, A.M., M.E. Keith, E.E. Voisin, P. Hesp, G. Cook, M. Allison, G. da Silva, and E. Swanson.
Evans, A.M.