By Diana Watters, Research Fisheries Biologist - National Marine Fisheries Service, Southwest Fisheries Science Center, Santa Cruz
October 11, 2019
Our dive on this night was in an area where large numbers of sponges have been brought up during bottom trawl surveys off southern Oregon. At depths of 770 – 560 meters (2,526 - 1,837 feet), we collected several specimens and completed five quantitative survey transects. One of the objectives of the EXPRESS cruise is to collect quantitative information about the seafloor communities in the areas we are studying. To characterize these communities as accurately as possible, our surveys must be standardized to avoid bias and conducted multiple times to capture variation. This means that we need to measure the area we are surveying, and within that area, identify the animals that we see, count them, and estimate their size. We also need to identify and measure the types and amount of seafloor habitats within the survey area. How is this done with the remotely operated vehicle (ROV)?

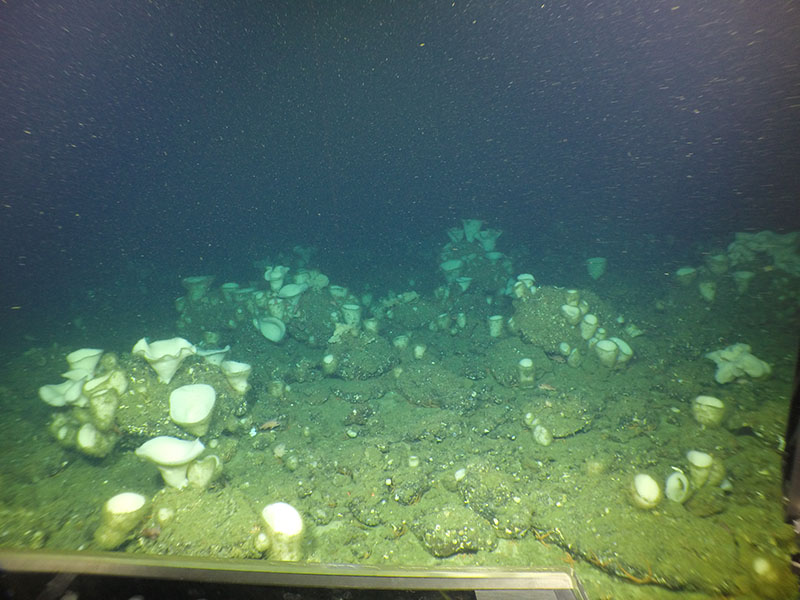
A still photo taken during a quantitative survey transect at Daisy Bank off Newport, Oregon, at 130 meters (426 feet) depth. The red laser dots are 10 centimeters (~4 inches) apart and are located near the middle of the lower part of the screen. Lots of sponges and a few small rockfishes on boulder/cobble habitat will be recorded from the video during this part of the transect, as the ROV Yogi transits forward at a consistent speed, height off the seafloor, and direction. Image courtesy of NOAA, USGS; taken from the GFOE ROV Yogi. Download larger version (jpg, 4.1 MB).
Enter the quantitative survey transect! During an ROV dive, we conduct multiple transects of 15 minutes duration or about 200-250 meters (656-820 feet) in length, and space them at least 100 meters (328 feet) apart from each other. The key to standardizing a transect and avoiding bias is to operate the ROV as consistently as possible, by maintaining a constant speed (typically 0.5 knots), height above the seafloor (about 1 meter), and a predetermined direction. Although the video camera mounted on the ROV records the entire dive, only the portions of the video within the start and end times of the transects are analyzed quantitatively, due to the standardized way in which the ROV is operated within those times (i.e., no stopping or changing direction to look at something, which would bias the survey). Back at the lab, all of the corals, sponges, and fishes within each transect are identified and counted from the video. Their sizes are estimated using the laser dots that are spaced 10 centimeters (~4 inches) apart. The width of the transect is estimated at intervals, using the laser dots, and the length of the transect and habitat patches within it is measured by a Doppler velocity logger mounted on the ROV. The area of the transect is estimated from its average width multiplied by its length.

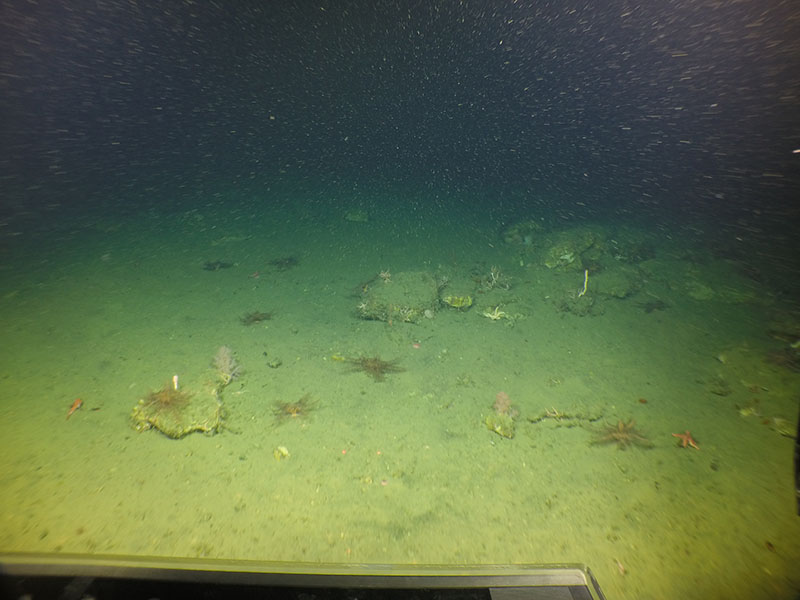
A still photo taken during a quantitative survey transect off southern Oregon, at 650 meters (2,132 feet) depth. The red laser dots are 10 centimeters (~4 inches) apart and are located near the middle of the lower part of the screen. Corals and a thornyhead on mud/cobble habitat will be recorded from the video during this part of the transect, as ROV Yogi transits forward at a consistent speed, height off the seafloor, and direction. Image courtesy of NOAA, USGS; taken from the GFOE ROV Yogi. Download larger version (jpg, 3.9 MB).
From these data, we can calculate the density of corals, sponges, and fishes (number per square meter) within each transect, and how much variation exists across multiple transects. This information is crucial to assessing the abundance and distribution of these organisms relative to seafloor habitats, location, depth, temperature, and other physical factors and for characterizing the seafloor community as a whole.