By Shannon Hoy, NOAA Office of Ocean Exploration and Research
September 15, 2019

Figure 1. Google Earth displays of Earth (left), the Moon (middle), and Mars (right). Image from Google Earth. Download image (jpg, 250 KB).
One objective of the first leg of the recent Deep Connections 2019 expedition on NOAA Ship Okeanos Explorer was to collect information about the seafloor using the ship’s mapping system to help in the search for the U.S. Revenue Cutter (USRC) Bear off the coast of Nova Scotia, Canada.
A primary way that NOAA Ship Okeanos Explorer explores the ocean is by mapping the seafloor with its hull-mounted EM 302 multibeam sonar. The Okeanos team targets areas that have little or no direct measurements of depth (bathymetry), which is required to determine the shape and topography (morphology) of the bottom of the ocean. You may have seen maps of the ocean such as those used for Google Earth and you think, “Isn’t the seafloor already completely mapped?!” Well, yes and no. Those maps that you see are generally created using data collected by satellites, which are also used to map everything above the sea surface on Earth, our moon, and even other planets (Figure 1).
However, satellites cannot actually “see” below the surface of the ocean, so instead these maps of the seafloor are made by a complex method of relating local changes in the height of the sea surface (little bumps and troughs) to likely seafloor features. This method is called satellite altimetry, and it is an indirect method of mapping the seafloor at a coarse resolution. Satellite-based measurements have been used to map the global bathymetry of the ocean, but only to an average resolution of about five miles . To resolve features smaller than this requires measurements from ships or submersible vehicles equipped with modern seafloor mapping systems (typically sonars).
Knowledge of detailed seafloor bathymetry and morphology is critical for several reasons, including safe navigation, ocean resource management, ocean infrastructure development, and understanding of ocean processes. However, current estimates suggest that only approximately 10-15 percent of the ocean has been directly mapped at these finer resolutions. These finer-resolution data are required to detect smaller features on the bottom of the ocean, such as shipwrecks (Figure 2)!
Fortunately the bathymetry and backscatter from the Okeanos Explorer’s EM 302 multibeam sonar can be used to find sunken vessels. The bathymetry shows us the shape of the seafloor and the backscatter gives us the intensity of the acoustic return, which means that harder, metal surfaces like those of ships will reflect more sound back and will show up differently from the surrounding sediment.

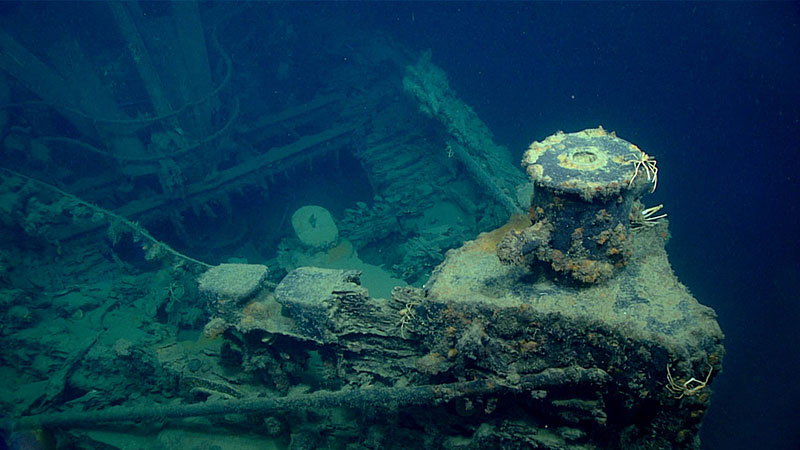
Figure 2. Port side of what is believed to be the tugboat New Hope, which was sunk during Tropical Storm Debbie in September 1965. Image courtesy of the NOAA Office of Ocean Exploration and Research, Gulf of Mexico 2018. Download image (jpg, 669 KB).
Discovering and confirming locations of shipwrecks and Underwater Cultural Heritage (UCH) sites is an exciting application of Okeanos Explorer seafloor mapping. However, there is a limit to the size of the features that the EM 302 can detect, which is dictated by water depth and the ship’s speed. These variables determine the number of soundings (echo measurements of the seafloor) in a given area (sounding density), which defines our ability to resolve a feature in bathymetry. So, the deeper the seafloor, the coarser the resolution and the less we can detect smaller objects. Likewise, a coarser resolution results when the ship is going faster. For example, when we are looking for shipwrecks in 3,000 meters (1.86 miles) of water, traveling at 4 knots, the smallest object we could possibly detect is on the order of 100 meters (328 feet). In shallower waters, say 300 meters (985 feet), we could detect objects on the order of 10 meters (33 feet)!
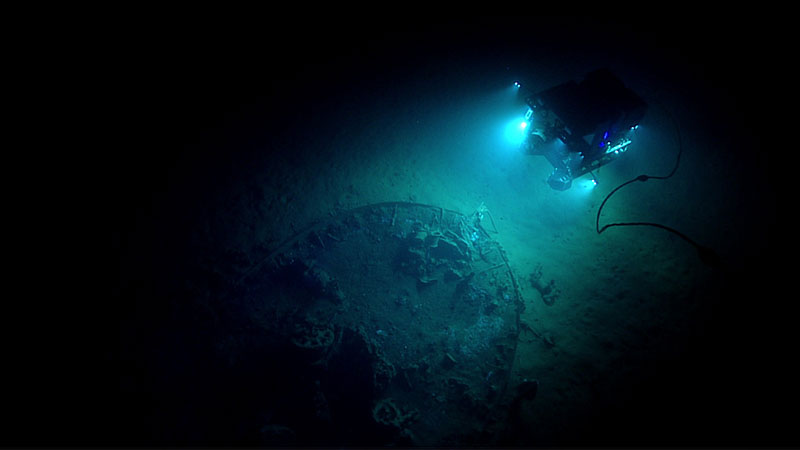
Expert knowledge from historians and archaeologists help constrain the search area and increase the likelihood that we will be able to find a shipwreck. An analogy to looking for shipwrecks is to search for a needle in a field of haystacks with a weak metal detector. Experts can help locate the likely haystack from the field, and then the likelihood that you can find the needle will depend on what the needle is made of, how close it is to the surface of the haystack, how quickly you are moving the metal detector over it, and your ability to hear the detection noise. It is so exciting when everything aligns and a shipwreck is discovered (Figure 3)! This video is a great overview of our exploration of UCH sites.

Figure 3. During the seventh dive of the Gulf of Mexico 2017 expedition, remotely operated vehicle Deep Discoverer explored an unknown shipwreck identified by the Bureau of Ocean Energy Management simply as “ID Number 15377.” Image courtesy of the NOAA Office of Ocean Exploration and Research, Gulf of Mexico 2017. Download image (jpg, 335 KB).
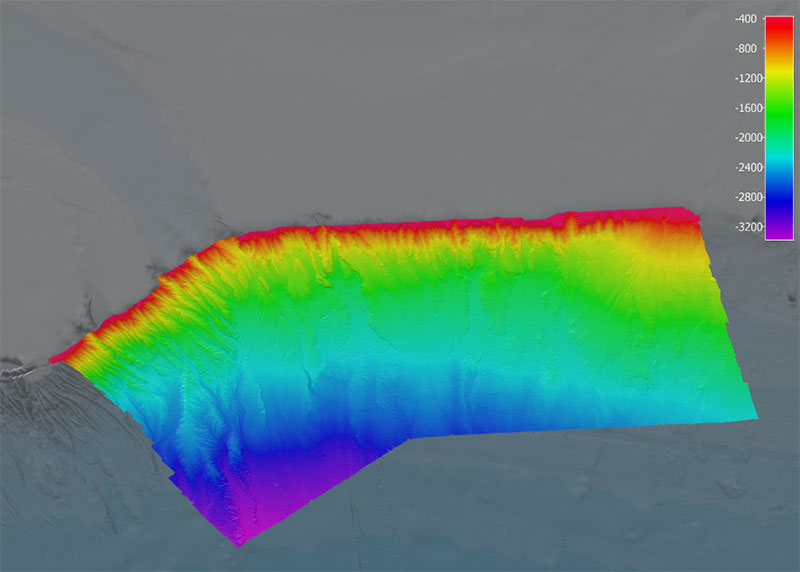
During the Deep Connections 2019 expedition, the Okeanos Explorer team mapped an area where experts expect the USRC Bear to reside to acquire higher-resolution data than the existing altimetry data (Figure 4). Most of this area is in deep water, where it is difficult for the EM 302 multibeam to detect the approximately 60-meter-long wreck, even at slow speeds. However, data collected during this mapping effort is currently being applied to narrow down which haystack archaeologists should pursue with different tools that can collect higher-resolution data, such as towed side scan sonars or synthetic aperture sonars.
The mapping data from the Deep Connections 2019 expedition put us one step closer to finding the famed USRC Bear, and we look forward to the findings from the Search for the U.S. Revenue Cutter Bear expedition!

Figure 4. High-resolution multibeam data collected during the Deep Connections 2019 expedition overlain on existing altimetry data, shown in grey. Image courtesy of the NOAA Office of Ocean Exploration and Research, Deep Connections 2019. Download image (jpg, 253 KB).