
By Brian Philip Ulaski, Graduate Student – Biological Oceanography, University of Alaska Fairbanks
To investigate spatial variability of microbial communities in the Arctic, we use geographic maps to visualize the relative abundance of individual taxa across stations and depths. The relative abundance is shown as the percent contribution of a given taxon per sample. We compare these biological maps to maps of physical and chemical environmental conditions to make inferences about the ecology of the microorganisms that inhabit the Arctic.
We’ll use the Chukchi Sea (located off the northwest coast of Alaska) as an example. One important environmental parameter is temperature (Figures 1A, 2A), which ranges from -2°C in the cold bottom waters in the northern Chukchi Sea to +10°C in the surface waters along the coast. Nutrients are also important in determining the microbial communities, especially nitrate (Figure 3A), which stimulates phytoplankton production.
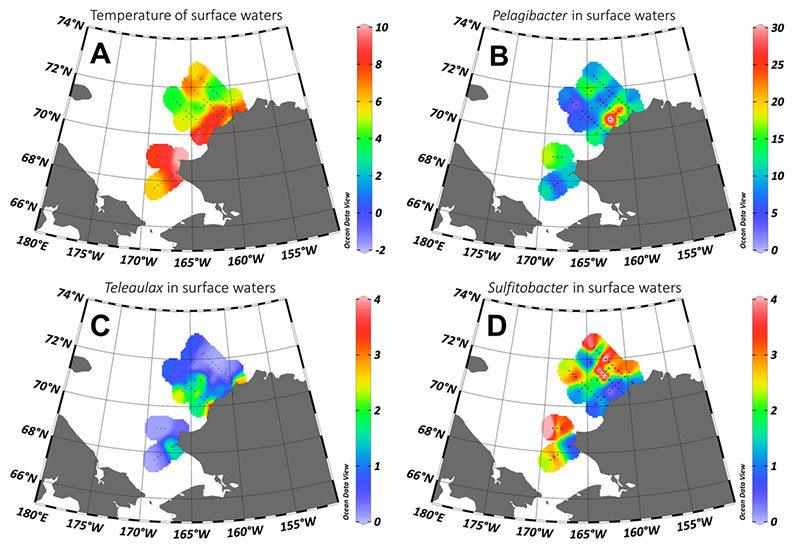
Figure 1. Distributions of temperature (A) and relative abundances of Pelagibacter (B), Teleaulax (C), and Sulfitobacter (D) in surface waters (five meters depth). Here you can see the contrasting distributions of Pelagibacter and Sulfitobacter within the Alaska Coastal Current. Image courtesy of the Mapping the Uncharted Diversity of Arctic Marine Microbes expedition. Download larger version (jpg, 398 KB).
We have identified biogeographical patterns displayed by a number of taxa within the Chukchi Sea. For example, Pelagibacter (a bacterium), though relatively abundant in most of samples, is most abundant in the Alaska Coastal Current (ACC; Figure 2B). This current flows northward along the western coast of Alaska, bringing water (and plankton) from lower latitudes, and contributing to the formation of relatively warm and fresh Alaskan Coastal Water (ACW). Pelagibacter is likely the most common bacteria in the world’s ocean basins and is known to prefer low-nutrient waters where its small size and efficient heterotrophic metabolism allow it to flourish where other microbes can’t. In the same waters, where river discharge influences the coastline, we also see an increased abundance of Teleaulax, a single-celled alga that is common occurrence in fresh and brackish waters (Figure 1C). In contrast, other taxa appear to favor offshore waters outside of the ACC. For example, Sulfitobacter (a bacterium; Figure 1D) metabolizes sulfur compounds including DMSP (dimethylsulphoniopropionate), generating the climate-active gas dimethyl sulfide (DMS).
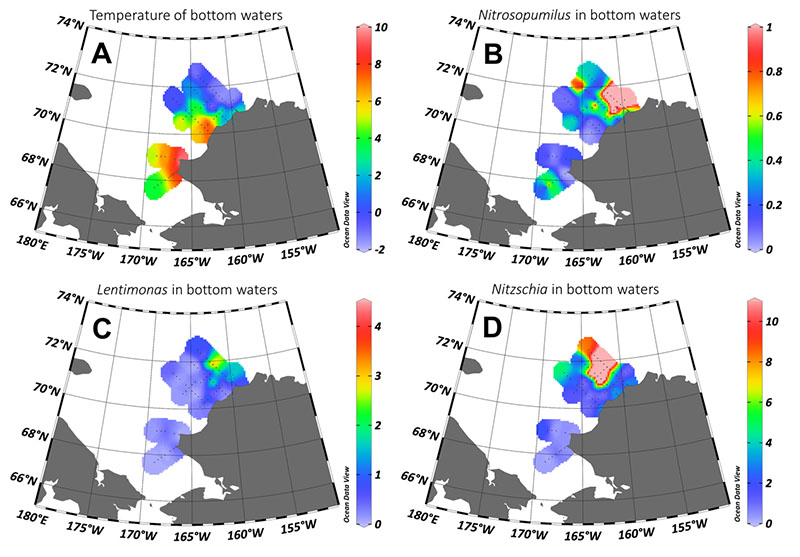
Figure 2. Distributions of temperature (A) and relative abundances of Nitrosopumilus (B), Lentimonas (C), and Nitzschia (D) in near-bottom waters. The presence of the cold and deep Bering-Chukchi Winter Water at the northeasternmost stations is apparent. Relative abundances of Nitrosopumilus, Lentimonas, and Nitzschia are highest in this water mass. Image courtesy of the Mapping the Uncharted Diversity of Arctic Marine Microbes expedition. Download larger version (jpg, 394 KB).
Another pattern we observe is that Nitrosopumilus (an archaeon) and Lentimonas (a bacterium) appear more abundant in the deeper, colder, and saltier water mass in the Northeastern Chukchi Sea region (Figures 2B and 2C). These taxa look to be associated with the Bering-Chukchi Winter Water (BCWW), a water mass that is a product of the previous winter’s cooling, brine rejection, and nutrient accumulation. Nitrosopumilus is particularly abundant in cold waters throughout the world’s ocean basins, and is responsible for regenerating nitrate, the primary nutrient limiting the growth of phytoplankton. Lentimonas is somewhat more mysterious—it is present throughout the world’s ocean basins at low abundance, but its role there is not yet known. Following a similar pattern, Nitzschia (a eukaryotic alga) is a diatom associated with the same BCWW, showing a dramatic increase in relative abundance at depth compared to at the surface (Figure 2D). This diatom is known to inhabit polar waters and sea ice, and here may be associated with the seafloor.
Other patterns are observed in the south. The southernmost stations have relatively high nutrient concentrations at depth (to 45 meters, Figure 3A), similar to the concentrations found in the BCWW to the north. Although these samples share similar nutrient concentrations, Thalassiosira (a eukaryotic alga) appears to favor the Bering-Chukchi shelf waters seaward of the ACC, while remaining rare in the older, colder BCWW (Figure 3B).
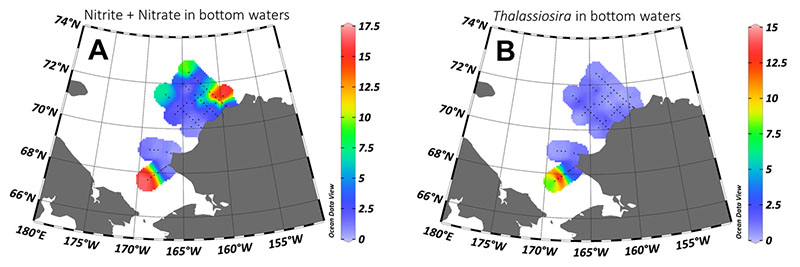
Figure 3. Distributions of nutrients (nitrate + nitrite) (A) and relative abundance of Thalassiosira (B) in near-bottom waters. The southernmost samples display high nutrient concentrations, similar to the concentrations found in the northern Bering-Chukchi Winter Water. Though these samples share similar nutrient concentrations, Thalassiosira appears to favor the Bering-Chukchi shelf waters seaward of the Alaska Coastal Current, while remaining rare in the older, colder Bering-Chukchi Winter Water. Image courtesy of the Mapping the Uncharted Diversity of Arctic Marine Microbes expedition. Download larger version (jpg, 200 KB).
The circulation of water in the Chukchi Sea appears to have an influence on the spatial variability of marine microbial communities. Water mass formation and distribution are affected by and directly influence the climate through carbon dioxide drawdown during phytoplankton blooms and the production of DMS gas. Identifying these important members of microbial communities in the Arctic and monitoring their variability over time and space will provide further insight into how the Arctic will be altered as it continues to be impacted by a warming climate.
The following slideshow of figures represents relative abundances of several microbial taxa in the lower water column (~35 meters). The colorbar denotes percent contribution of a given taxon to each near-bottom sample (note that the colorbars are not set to the same scale). The last three figures of temperature, salinity, and nitrate concentrations of the near-bottom samples are provided for reference of physicochemical variability.
Below are figures showing some of the diversity this project is seeing. When looking at these, it is important to keep in mind they are all relative, not absolute, abundances, because we don't yet have good high-throughput methods for quantifying the organisms yet.
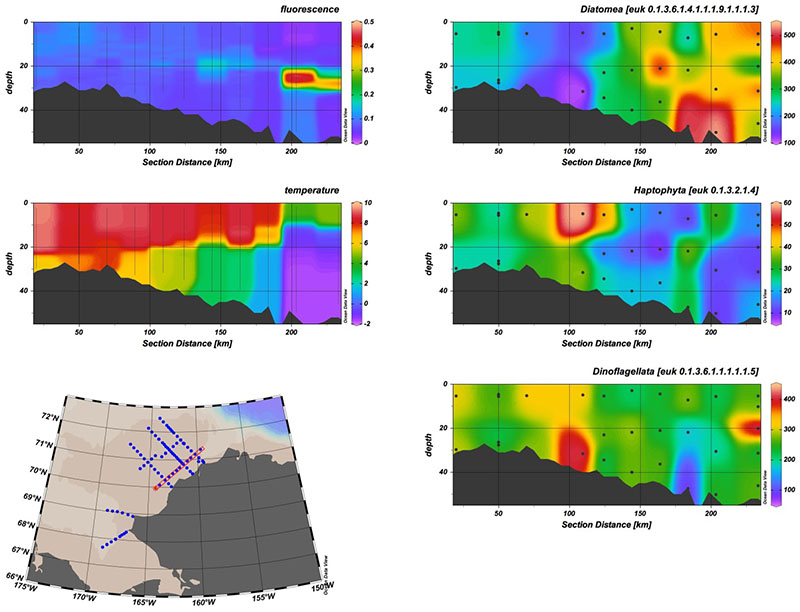
Here you can see two different groups of phytoplankton—diatoms and haptophytes—segregating out along a transect based on temperature and water mass. The relative abundance of diatoms at depth is interesting as well and may indicate sinking of diatom cells, e.g. from sea ice communities or benthic diatom communities, which we also know exist here. Collaborators are looking at benthic chlorophyll concentrations, so that should help answer that question. The dinoflagellates, which are often mixotrophic, are pretty evenly distributed throughout. Image courtesy of the Mapping the Uncharted Diversity of Arctic Marine Microbes expedition. Download larger version (jpg, 478 KB).
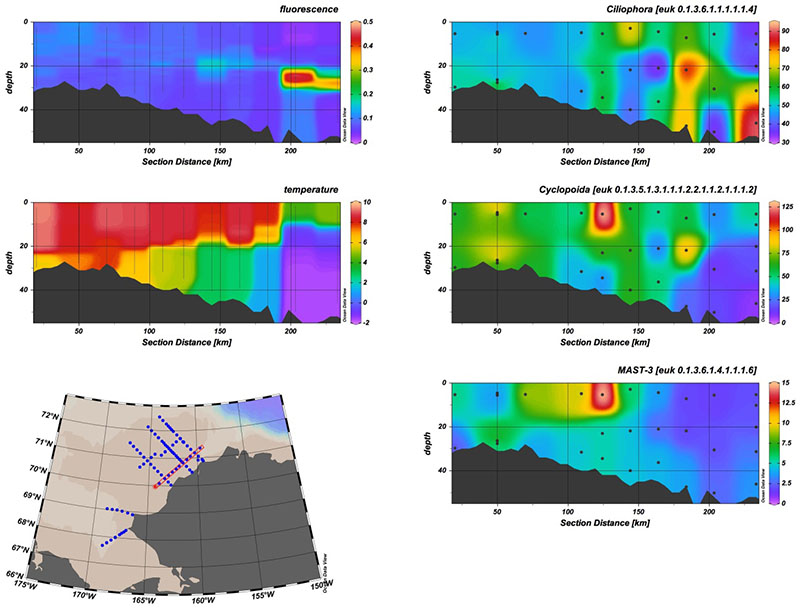
Here you can see some of the zooplankton, for example ciliates, cyclopoid copepods, and an uncultured group of organisms called MAST-3, which is thought to be a parasite and here seems to be correlated with the copepods. Image courtesy of the Mapping the Uncharted Diversity of Arctic Marine Microbes expedition. Download larger version (jpg, 434 KB).
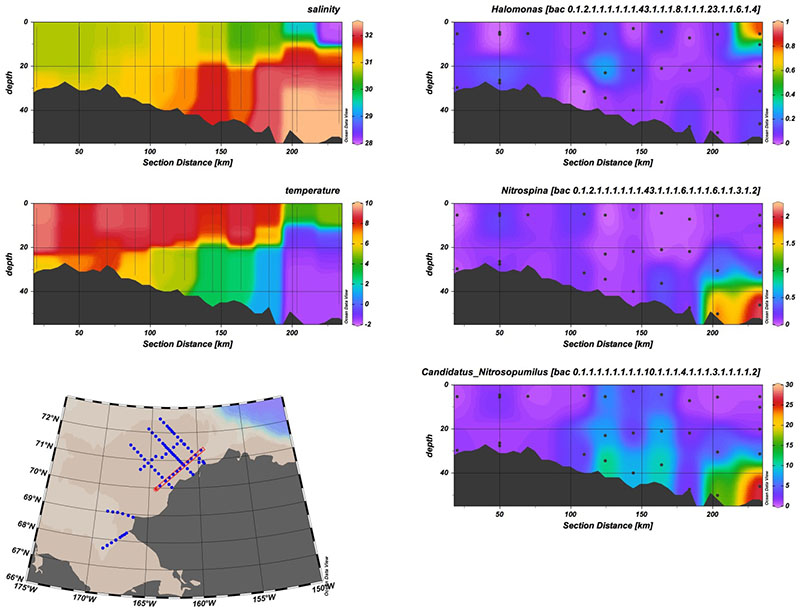
Here you can see several groups of bacteria found during this project. The top panel is Halomonas, which is found in sea ice and is probably persisting after being melted out (note the low salinity water it was found in). The two bottom panels are nutrient recyclers. Nitrosopumilus is an archaeon that converts ammonia to nitrite, and Nitrospina is a bacterium that converts nitrite to nitrate, which can be used by phytoplankton for growth. Image courtesy of the Mapping the Uncharted Diversity of Arctic Marine Microbes expedition. Download larger version (jpg, 494 KB).
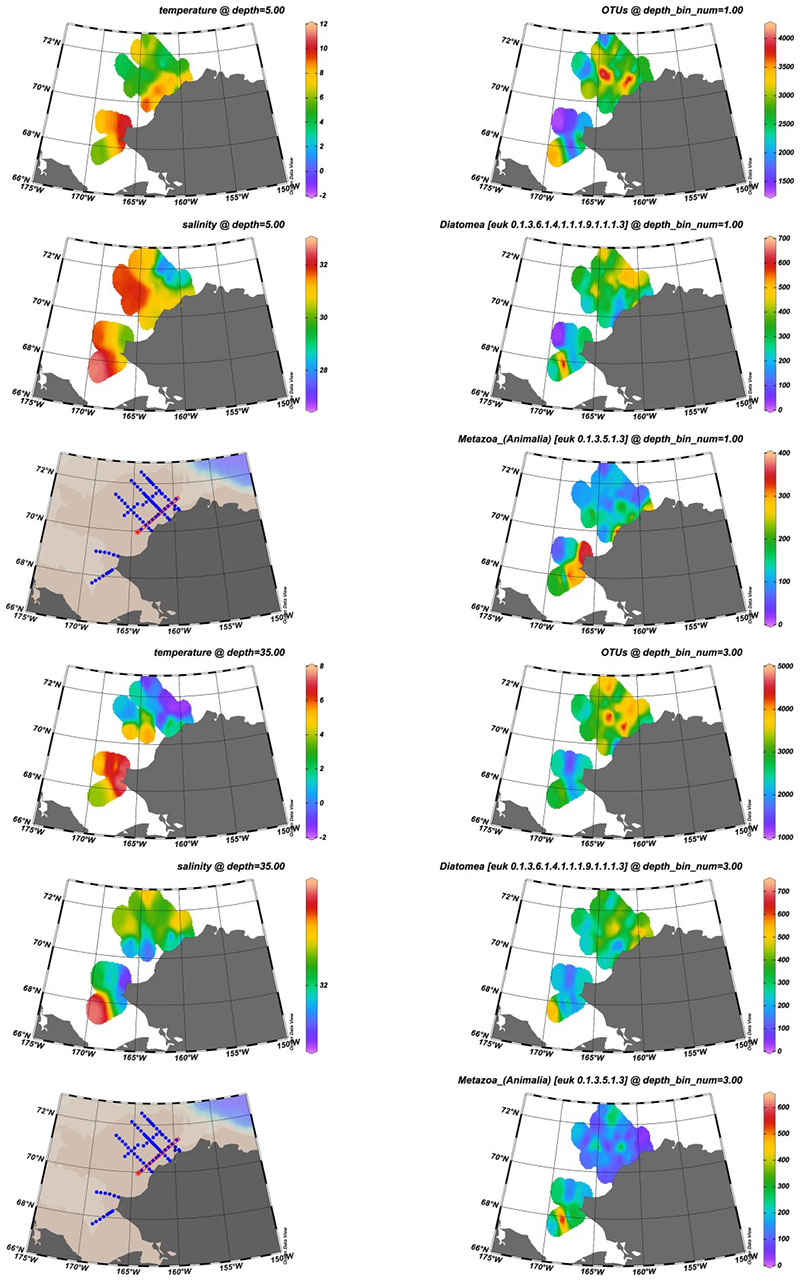
Here you can see the spatial distribution of total OTUs (operational taxonomic units, a molecular stand-in for “species”) and diatom and animal eDNA over the Chukchi Sea in the upper water column (~5 meters) and the lower water column (~35 meters). The overall diversity is at least thousands of molecular “species” at each station. Nitrosopumilus is an archaeon that converts ammonia to nitrite, and Nitrospina is a bacterium that converts nitrite to nitrate, which can be used by phytoplankton for growth. Image courtesy of the Mapping the Uncharted Diversity of Arctic Marine Microbes expedition. Download larger version (jpg, 655 KB).
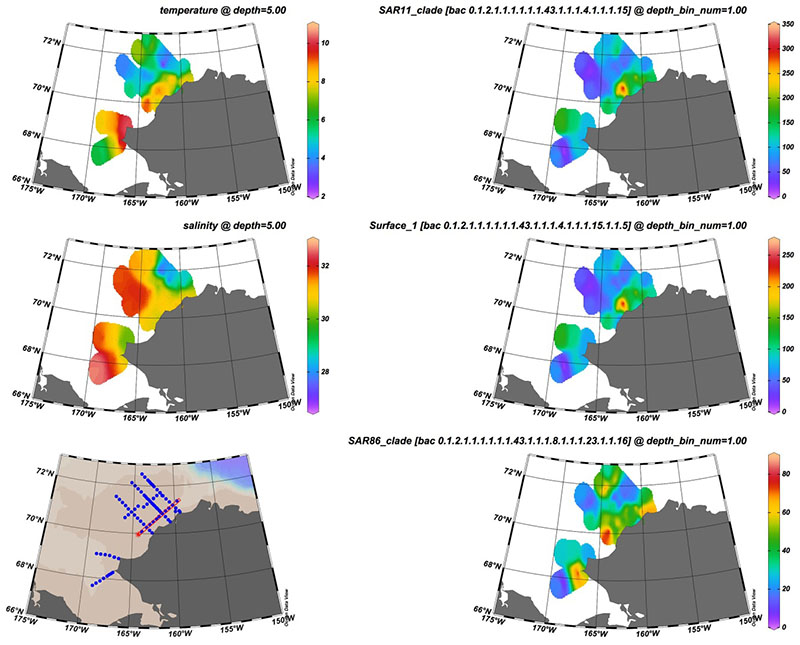
Here you can see a number of bacteria and archaea that appear more abundant in the Alaska Coastal Current, which runs near shore. These organisms were probably up brought from farther south and may include more terrestrial-associated organisms. Image courtesy of the Mapping the Uncharted Diversity of Arctic Marine Microbes expedition. Download larger version (jpg, 462 KB).
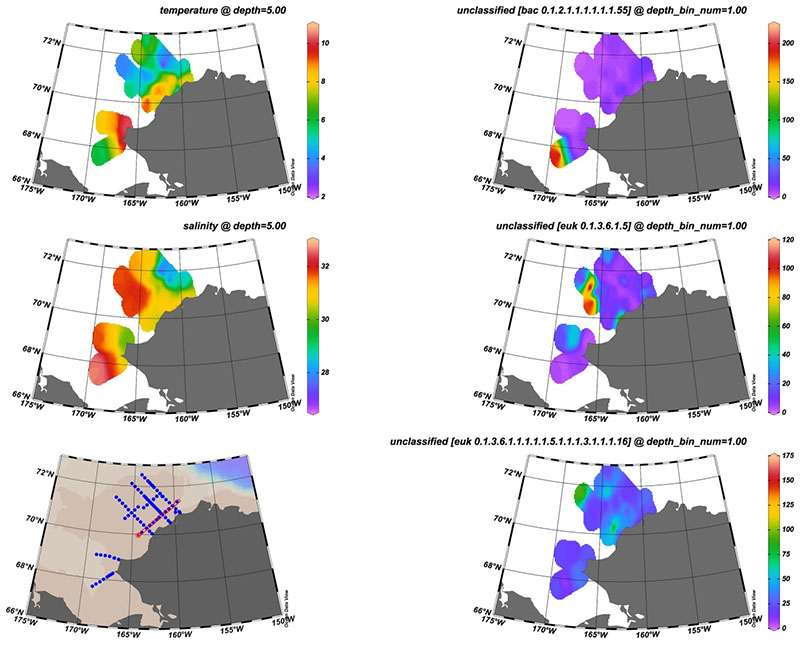
Here you can see the distributions of a number of organisms that we cannot yet identify by their DNA (“unclassified”), but which are present in relatively high abundance. This means that there is a lot left to discover about the diversity of life in the Arctic. Image courtesy of the Mapping the Uncharted Diversity of Arctic Marine Microbes expedition. Download larger version (jpg, 427 KB).