By Morgan Erhardt - Oregon State University
September 21, 2010
There is a multitude of information that can be gathered from multibeam sonar data. In this study, sonar is primarily being used to create maps of seafloor bathymetry in an effort to locate the San Andreas Fault off the California coast. Using the resultant multibeam data we can identify underwater features such as canyons and ridges, which can be used to delineate the extent of the fault.

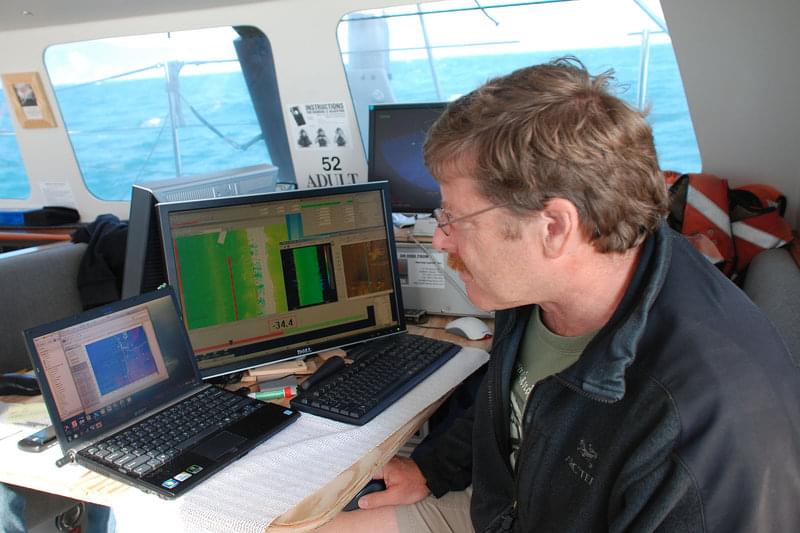
Dr. Chris Goldfinger, project PI, watches the multibeam screen as data returns in near-real time. Bathymetric and backscatter data obtained from multibeam sonar are used to determine seafloor depth as well as indicators of the type of sediment (hard or soft bottom) that is below. Image courtesy of San Andreas Fault 2010 Expedition, NOAA-OER. Download image (jpg, 136 KB).
The multibeam system we are using returns two different types of data; the first is Bathymetry and the second is Backscatter. The general principle of sonar is that we generate a sound at the boat, which travels down through the water column, reflects off the seafloor and returns to the boat where it is “heard” by the sonar head. The amount of time that it takes for the sound to travel to the sea floor and back (2-way travel time), in conjunction with the velocity sound travels in water (approx. 1,500 meters per second), allows us to determine the depth of water beneath the boat. An example of this would be if the sound took 0.5 seconds to travel from the boat to the seafloor and back to the boat again. The total distance the sound had traveled through the water could be determined by multiplying sound velocity (~1500m/s) by the number of seconds (0.5 sec) to get ~1,500 m/s x 0.5 s = 750 meters. Since we know the sound left the boat, hit the bottom and traveled back again we know that the depth must be half of the distance that the sound traveled, therefore we divide the distance the sound traveled by 2 and get a depth of 750 m / 2 = 375 meters. When we plot this depth information over the area that we covered we get a map of depth, which is also known as Bathymetry.

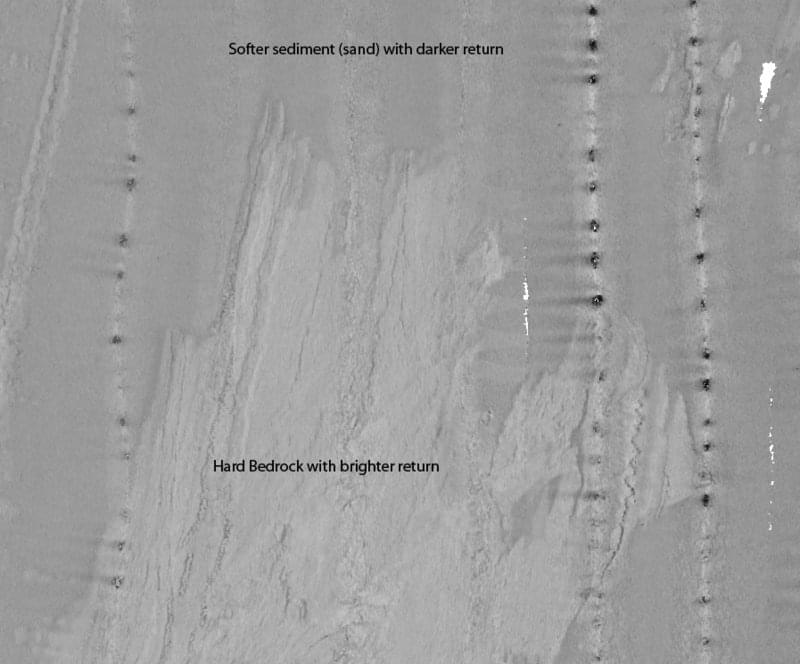
An example backscatter image generated from multibeam sonar data, showing the visual discrepancy between hard and soft seafloor sediments. Image courtesy of San Andreas Fault 2010 Expedition, NOAA-OER. Download image (jpg, 89 KB).
Our second type of data, Backscatter, is not depth information but instead the intensity of the sound return. This can be thought of as how well the sound has bounced off the sea floor. For example, when the sound reflects off of a hard surface, such as rock, a strong return is recorded. Alternately, when sound reflects off a softer surface, such as mud, a much weaker return is recorded because the mud absorbs more of the sound energy than the rock did and less is reflected back to the boat. Another example of backscatter can be perceived by walking into a canyon and yelling, the echo of your voice lets you know that you are surrounded by hard reflective objects (rocks). If you were to walk into a dense forest and yell the majority of the sound energy would be absorbed by the vegetation and you would not get much of an echo at all. When we plot this sound intensity onto a map of the seafloor we get a map that shows the hardness of the bottom material. This hardness helps us to map the composition of the sea floor. Generally we use brighter colors to indicate harder surfaces and darker colors to identify softer surfaces.

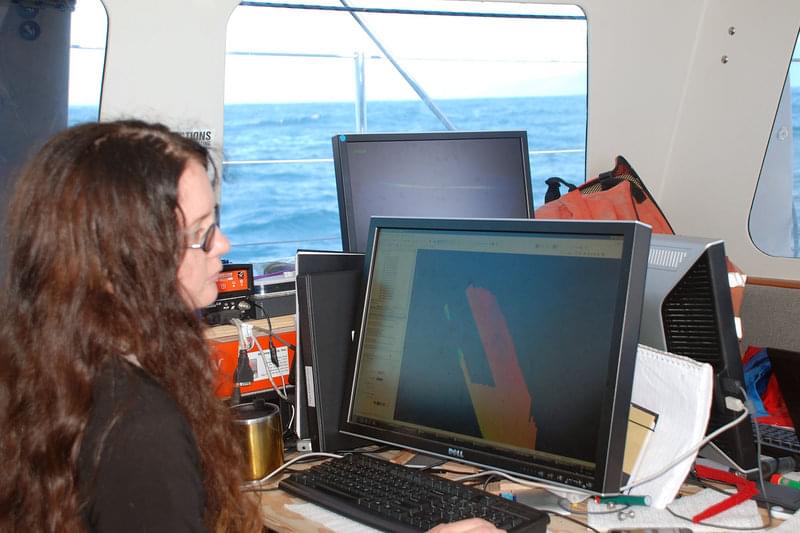
OSU graduate student Bran Black works with sonar bathymetry data to create a map of the sea floor in the area where the San Andreas Fault goes off shore. Image courtesy of San Andreas Fault 2010 Expedition, NOAA-OER. Download image (jpg, 126 KB).
Thus, by using a sonar, we are able to both determine the depth of the seafloor and obtain information about what type of sediments or hard bottoms are below.